Dead Simple Chat offers prebuilt Chat that can be added in minutes to any app or website. Can be completely customized and offers powerful API and SDK.
In this article I am going to list top 6 react chart libraries. Most of the libraries are built on top of react and D3 library
Most of these libraries are pretty easy to add to your project and default settings render good looking charts with animations.
You can also customize the charts as much as you want. Some libraries also have UI based customization tools that lets you customize using the User Interface and produce the code that you can just copy paste to your project
Let's consider some of the famous react charting libraries. I have also published a table that tells you how many github stars and weekly downloads the library has.
It will help you decide which library to go for
| Chart Library Name | Github Stars | Weekly Downloads |
|---|---|---|
| Victory | 10.1k | 119,490 |
| Recharts | 19.4k | 713,654 |
| Nivo | 10.9K stars | N/A |
| React-Chartjs-2 | 5.6k starts but Chart.js has 59.3k stars | 535,467 |
| airbnb Visx | 16.5k | 7,907 |
| React-Vis | 8.3K | 55,524 |
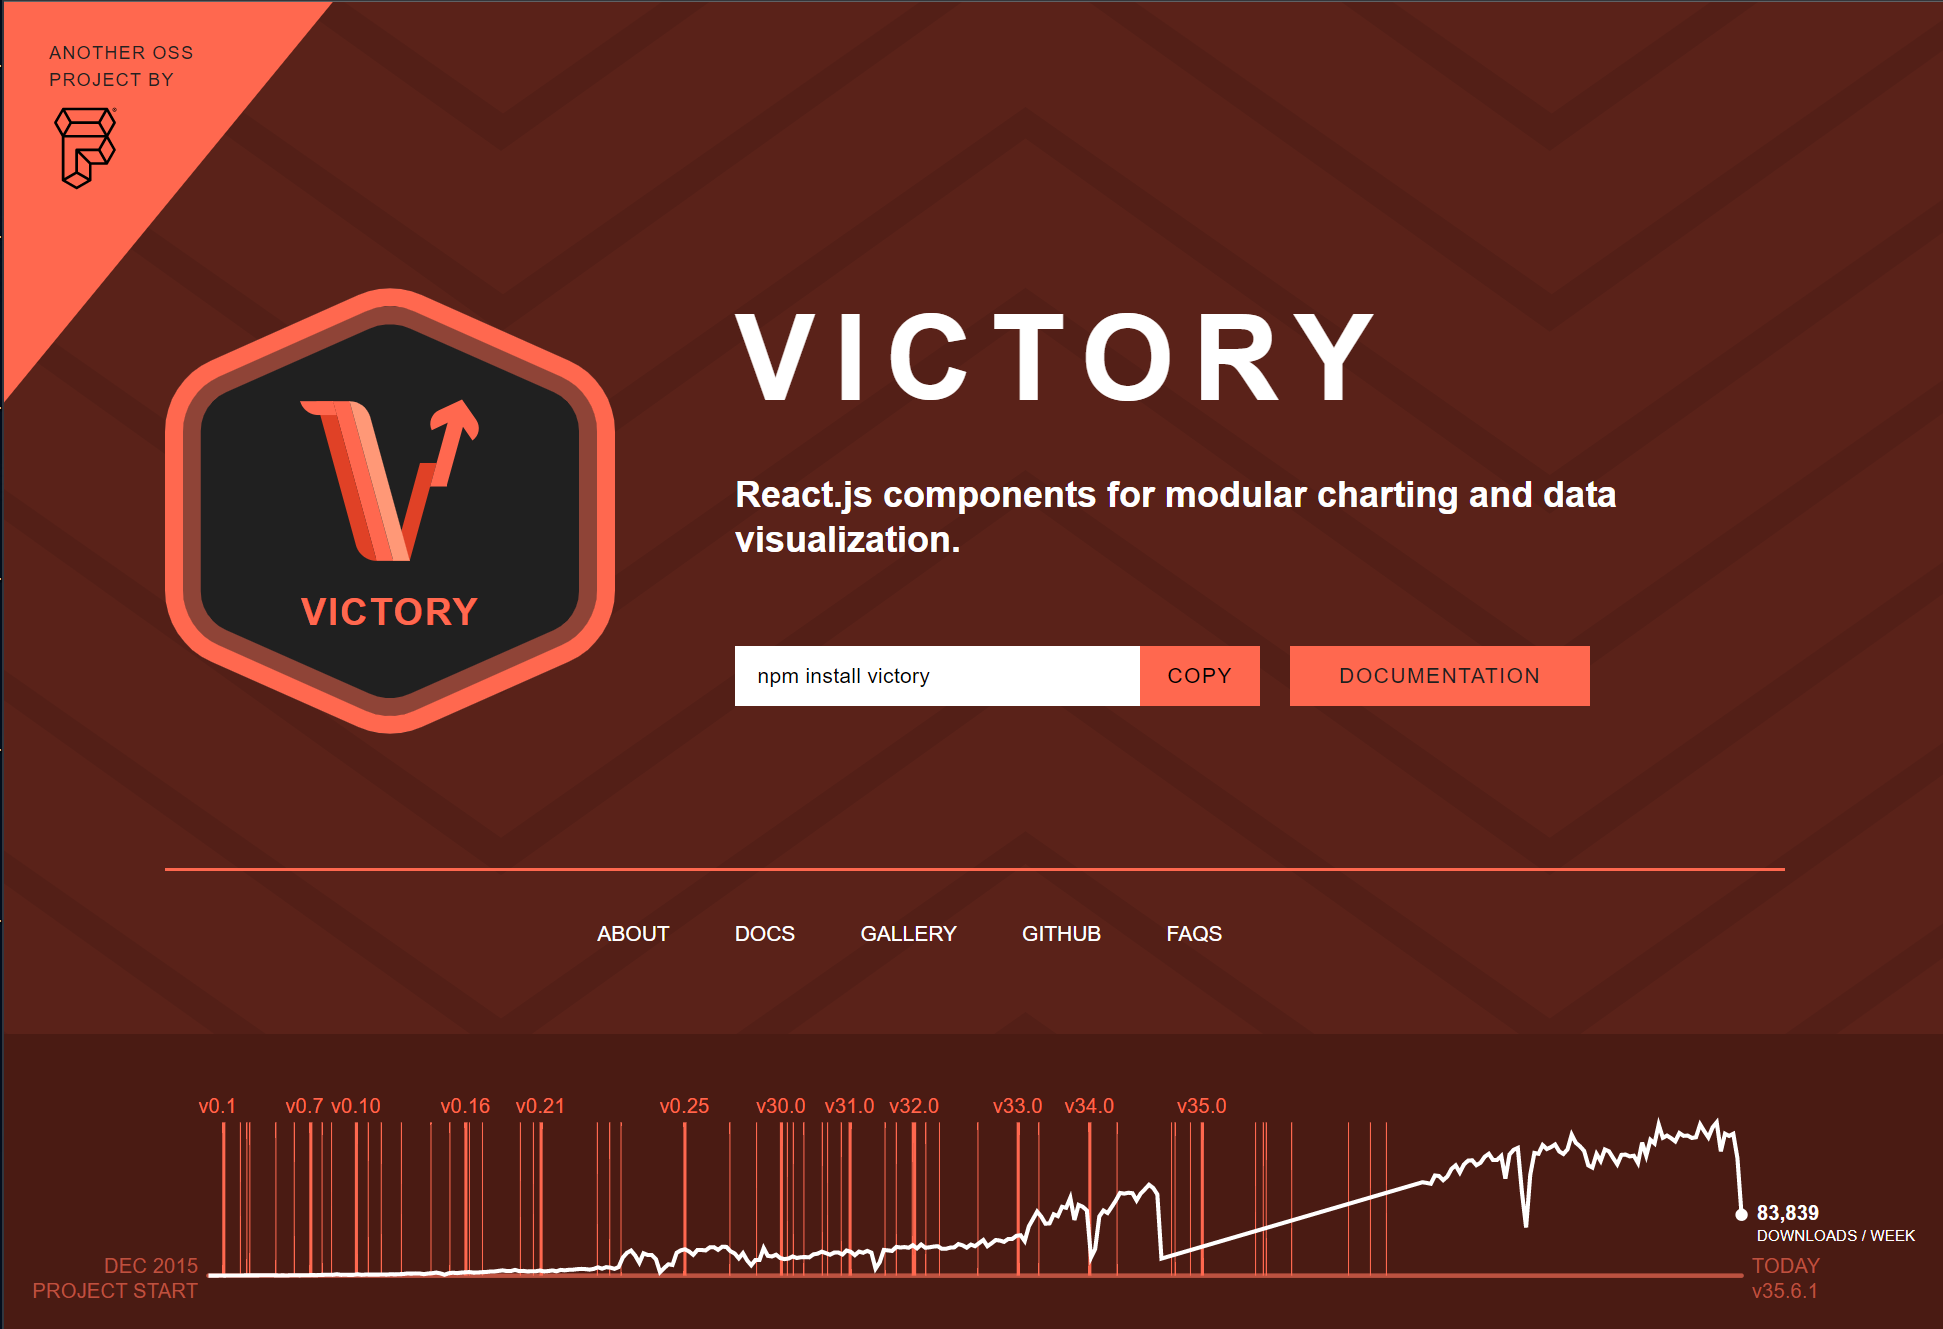
1 Victory
Victory is a set of modular charting components for React and React Native. You can build interactive visualizations with Victory with fully customizable styles and behaviors
Victory also uses the same cross platform API for React web and React Native for easy cross platform charting
Victory has 119,490 weekly downloads on npm and it is based on react and d3
Some of the features of victory include:
- Victory has easy to use components that can be used for complex charting purposes like Area Charts,Polygons and Scatter Plots
- Fully contained cirtualization elements that have their own data and are responsable for their own stylings etc
- Victory also has react native components for use in iOS and Android devices
Victory according to its website is being used by companies like: Airbnb, Redfin, Viacom, Zillow and others.
Here are the stats on the Victory
| Chart Library Name | Github Stars | Weekly Downloads |
|---|---|---|
| Victory | 10.1k | 119,490 |
A basic demo
Your React Project
import React from 'react';
import ReactDOM from 'react-dom';

class Main extends React.Component {
  render() {
    return (
      <div>
        <h1>Hello World</h1>
      </div>
    );
  }
}

const app = document.getElementById('app');
ReactDOM.render(<Main />, app);
Add Victory
import React from 'react';
import ReactDOM from 'react-dom';
import * as V from 'victory';
Add your data
you can import data from a external file or API
const data = [
  {revenue: 1, earnings: 13000},
  {revenue: 2, earnings: 16500},
  {revenue: 3, earnings: 14250},
  {revenue: 4, earnings: 19000}
];
Adding Victory Component
import React from 'react';
import ReactDOM from 'react-dom';
import { VictoryBar } from 'victory';
Rendering the Victory Component
<VictoryBar/>This is how the victory chart works
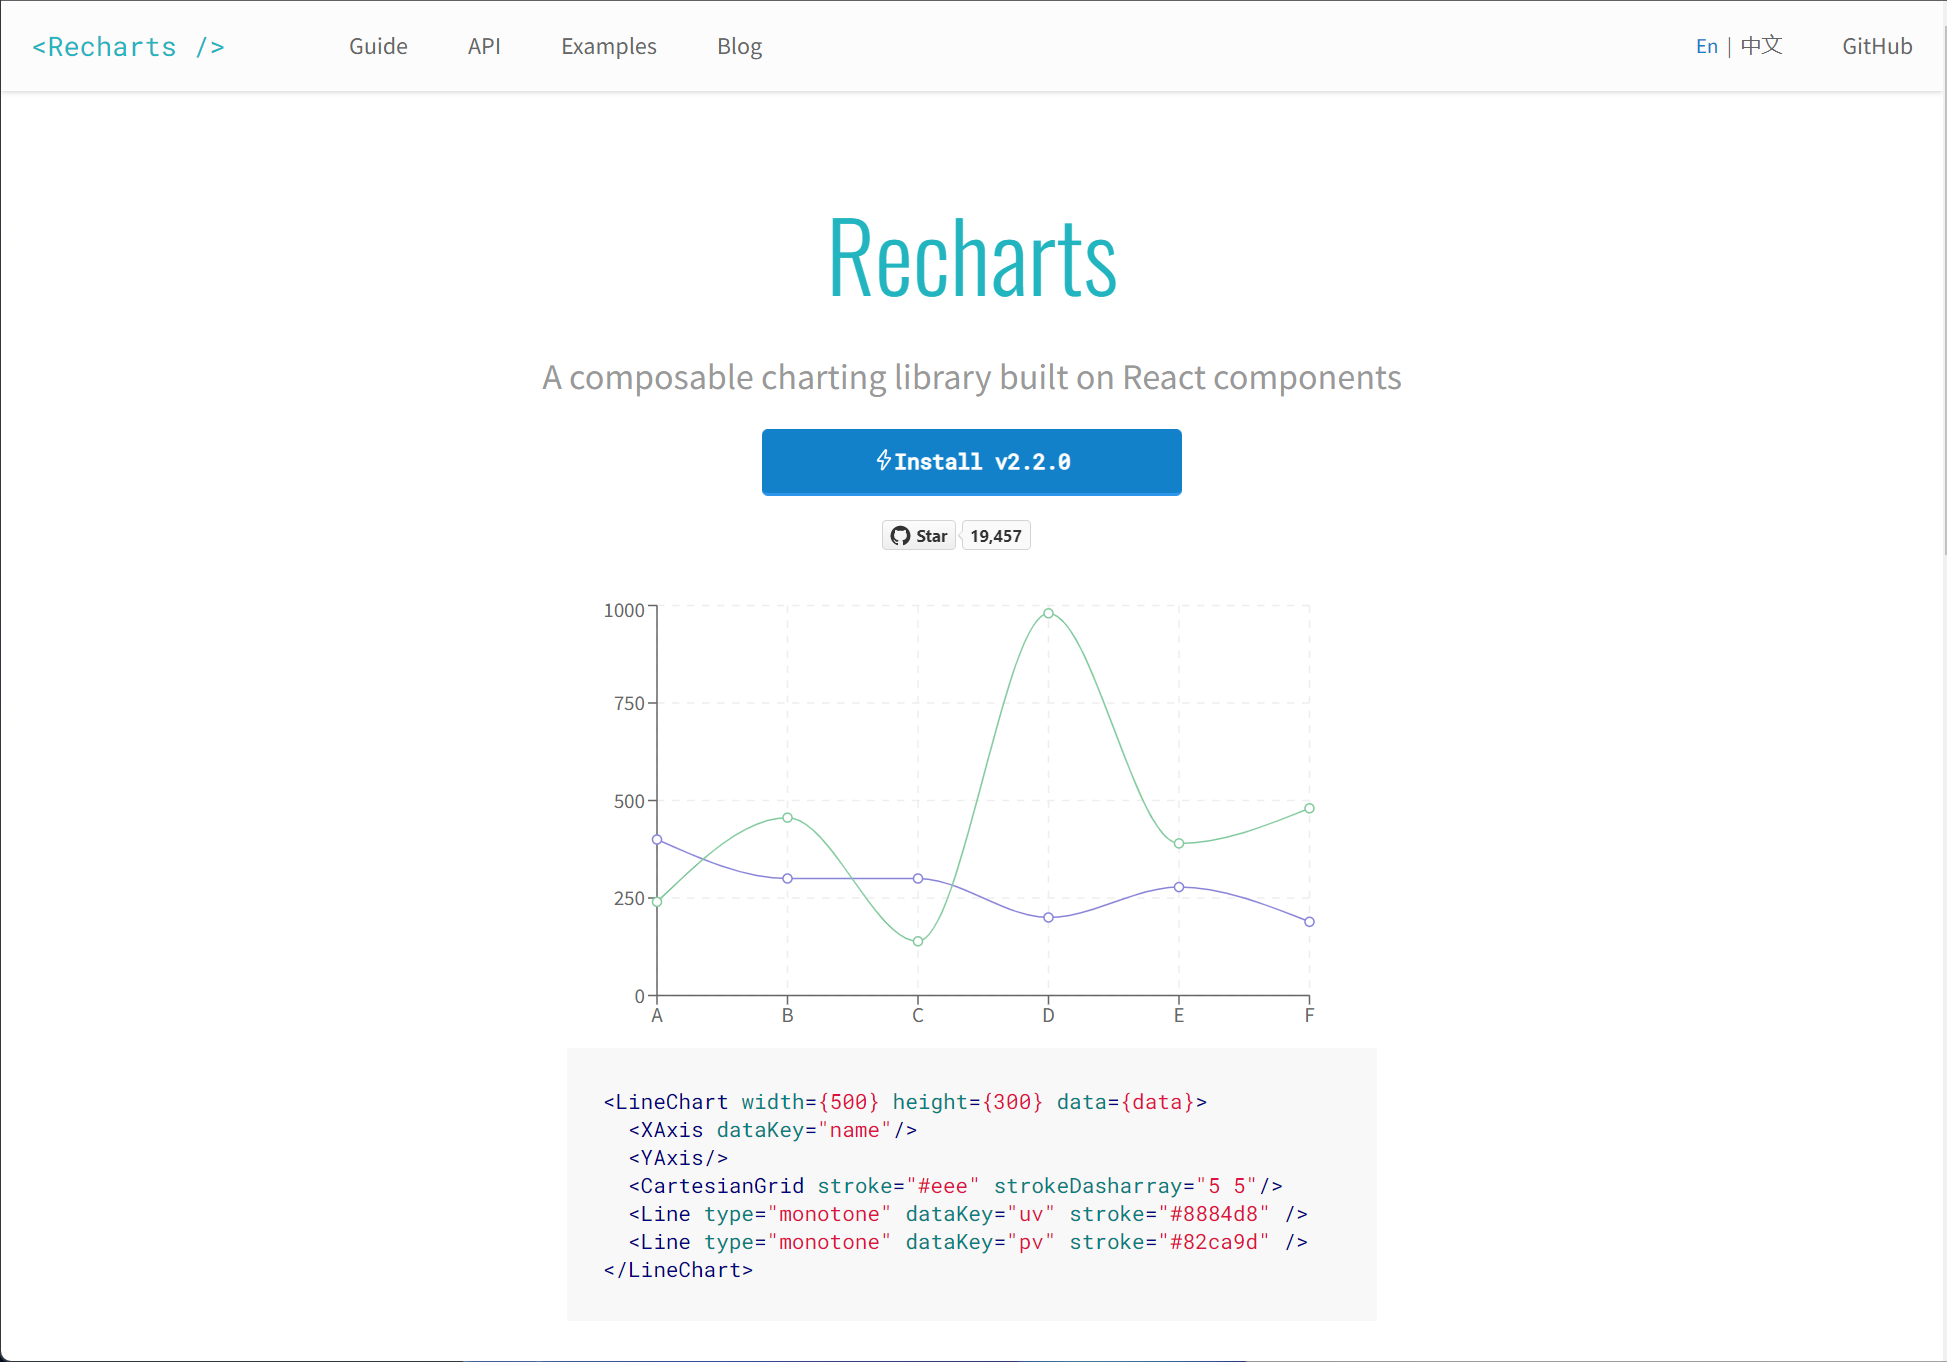
2 Recharts
| Chart Library Name | Github Stars | Weekly Downloads |
|---|---|---|
| Recharts | 19.4k Stars | 713,654 |
Recharts is a charting library made with react and d3. It is easy to use, you can simply create a line chart with a few lines of code

  <LineChart width={500} height={300} data={data}>
    <XAxis dataKey="name"/>
    <YAxis/>
    <CartesianGrid stroke="#eee" strokeDasharray="5 5"/>
    <Line type="monotone" dataKey="uv" stroke="#8884d8" />
    <Line type="monotone" dataKey="pv" stroke="#82ca9d" />
  </LineChart>
Here are some of the features of Recharts:
- Made with re-useable react components that are decoupled with other components
- Made with D3 library and SVG elements
- Easily customize the chart by passing custom components and changing component props
Many reputed companies use rechart libraries and some of them are listed on its website as well
A basic demo
We are going to generate a simple chart using an array or objects. Import the type of chat we need to draw
import { LineChart, Line } from 'recharts';
const data = [{name: 'Page A', uv: 400, pv: 2400, amt: 2400}, ...];

const renderLineChart = (
  <LineChart width={400} height={400} data={data}>
    <Line type="monotone" dataKey="uv" stroke="#8884d8" />
  </LineChart>
);
You can import a bit more components and make it look even better
import { LineChart, Line, CartesianGrid, XAxis, YAxis } from 'recharts';
const data = [{name: 'Page A', uv: 400, pv: 2400, amt: 2400}, ...];

const renderLineChart = (
  <LineChart width={600} height={300} data={data}>
    <Line type="monotone" dataKey="uv" stroke="#8884d8" />
    <CartesianGrid stroke="#ccc" />
    <XAxis dataKey="name" />
    <YAxis />
  </LineChart>
);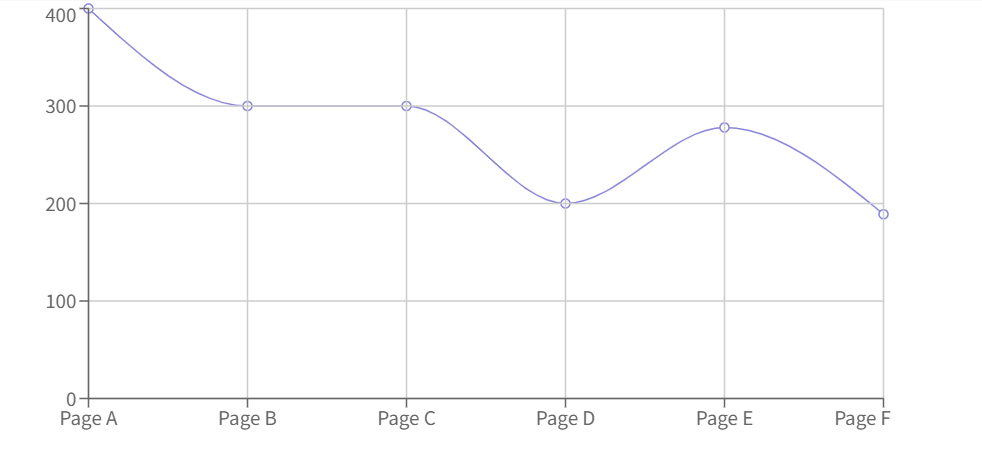
Thus recharts is an extremely simple and easy to use charting library. You can easily add it to your react project and use it simply as demonstrated above and its lightweight as well
With the help of the babel plugin you can import only the components that you need making it even more lightweight
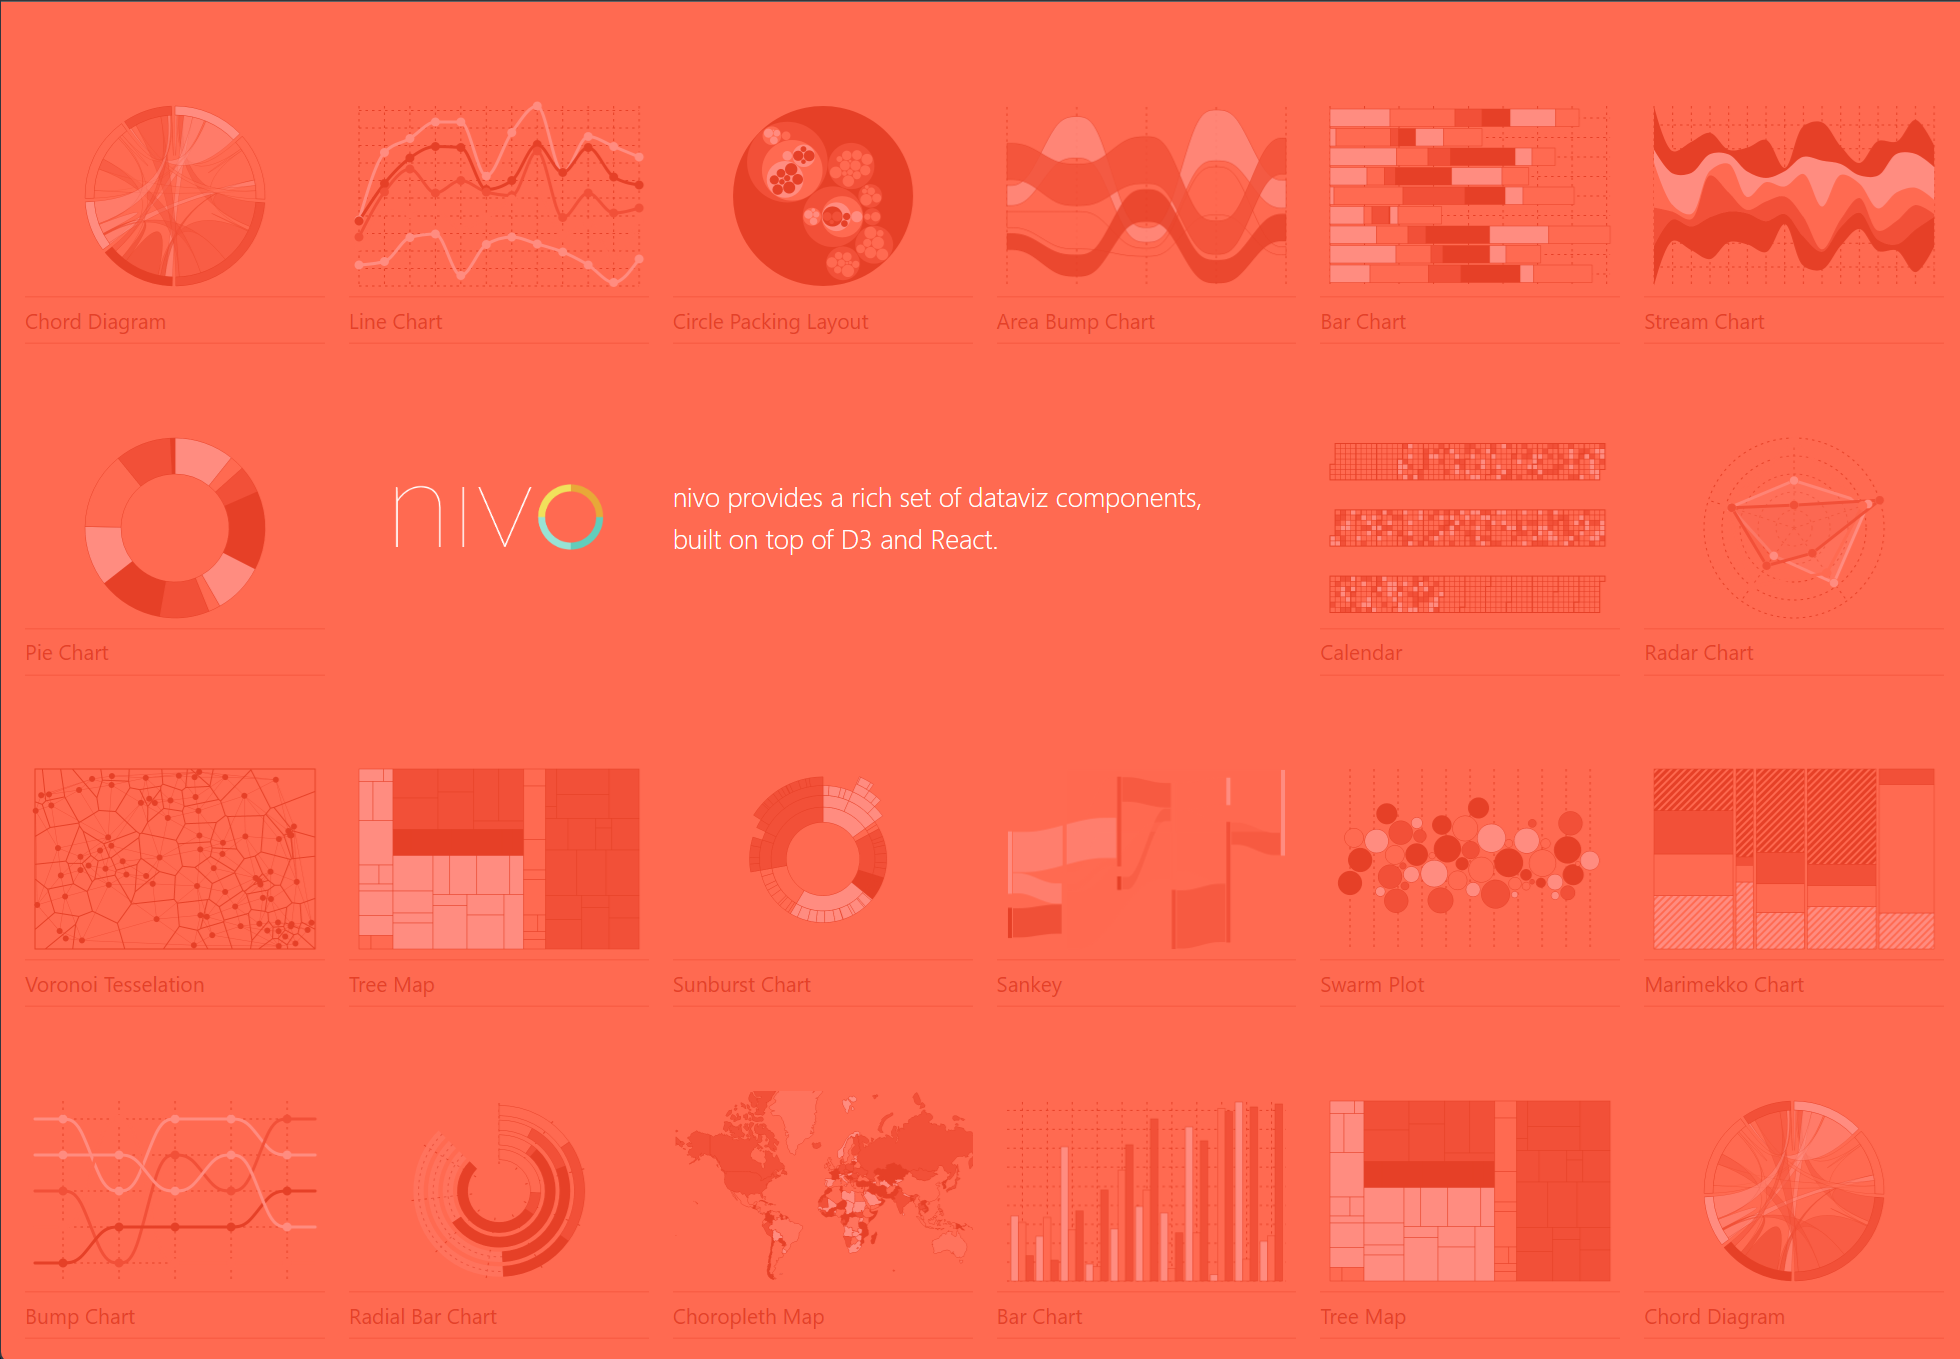
3. Nivo
Nivo is build with react components and the D3 library. Nivo provides server side rendering capability and declarative charts
| Chart Library Name | Github Stars |
|---|---|
| Nivo | 10.9k Stars |
Here are some of the features of Nivo
- It can be easily customized
- Transitions are available and powered by react-motion library
- Svg Charts
- HTML Charts
- Canvas Charts
- Gradients
- Responsive Charts
A whole lot of charts can be made with Nivo including line charts, bar charts, calender and much more
Some Charts are available in some formats and not available in other formats. So, look what you need and select from what's available
Nivo also has a editor and code selector, you can edit on the UI based editor and copy and paste the code on your website or app to add chart.
Pretty to add chart to your project
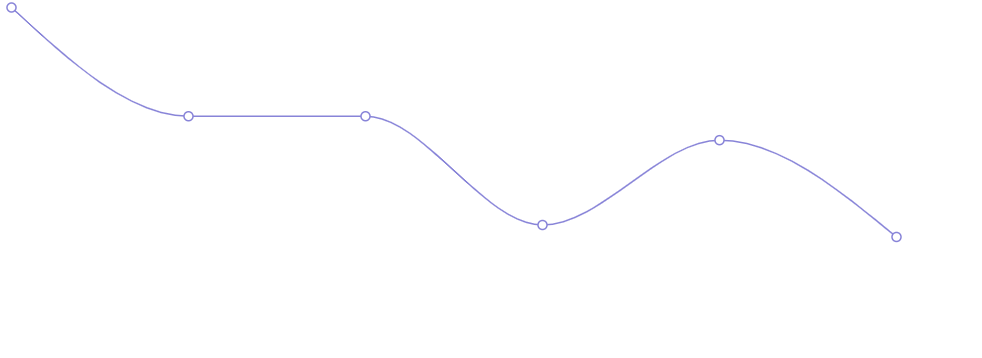
Here is a sample chart that I created using Nivo
A basic demo
install the nivo core and nivo bump from either yarn or npm install and import the ResponsiveBump and copy the code from the UI builder and paste it where you want the chart to appear
// install (please make sure versions match peerDependencies)
// yarn add @nivo/core @nivo/bump
import { ResponsiveBump } from '@nivo/bump'

// make sure parent container have a defined height when using
// responsive component, otherwise height will be 0 and
// no chart will be rendered.
// website examples showcase many properties,
// you'll often use just a few of them.
const MyResponsiveBump = ({ data /* see data tab */ }) => (
    <ResponsiveBump
        data={data}
        colors={{ scheme: 'spectral' }}
        lineWidth={3}
        activeLineWidth={6}
        inactiveLineWidth={3}
        inactiveOpacity={0.15}
        pointSize={10}
        activePointSize={16}
        inactivePointSize={0}
        pointColor={{ theme: 'background' }}
        pointBorderWidth={3}
        activePointBorderWidth={3}
        pointBorderColor={{ from: 'serie.color' }}
        axisTop={{
            tickSize: 5,
            tickPadding: 5,
            tickRotation: 0,
            legend: '',
            legendPosition: 'middle',
            legendOffset: -36
        }}
        axisBottom={{
            tickSize: 5,
            tickPadding: 5,
            tickRotation: 0,
            legend: '',
            legendPosition: 'middle',
            legendOffset: 32
        }}
        axisLeft={{
            tickSize: 5,
            tickPadding: 5,
            tickRotation: 0,
            legend: 'ranking',
            legendPosition: 'middle',
            legendOffset: -40
        }}
        margin={{ top: 40, right: 100, bottom: 40, left: 60 }}
        axisRight={null}
    />
)Nivo is easy to use library with the copy paste code UI editor that you can use to create good looking charts and add them to your projects
But not easily hackable and lot of code is generated by the UI builder and customizing that could be time consuming
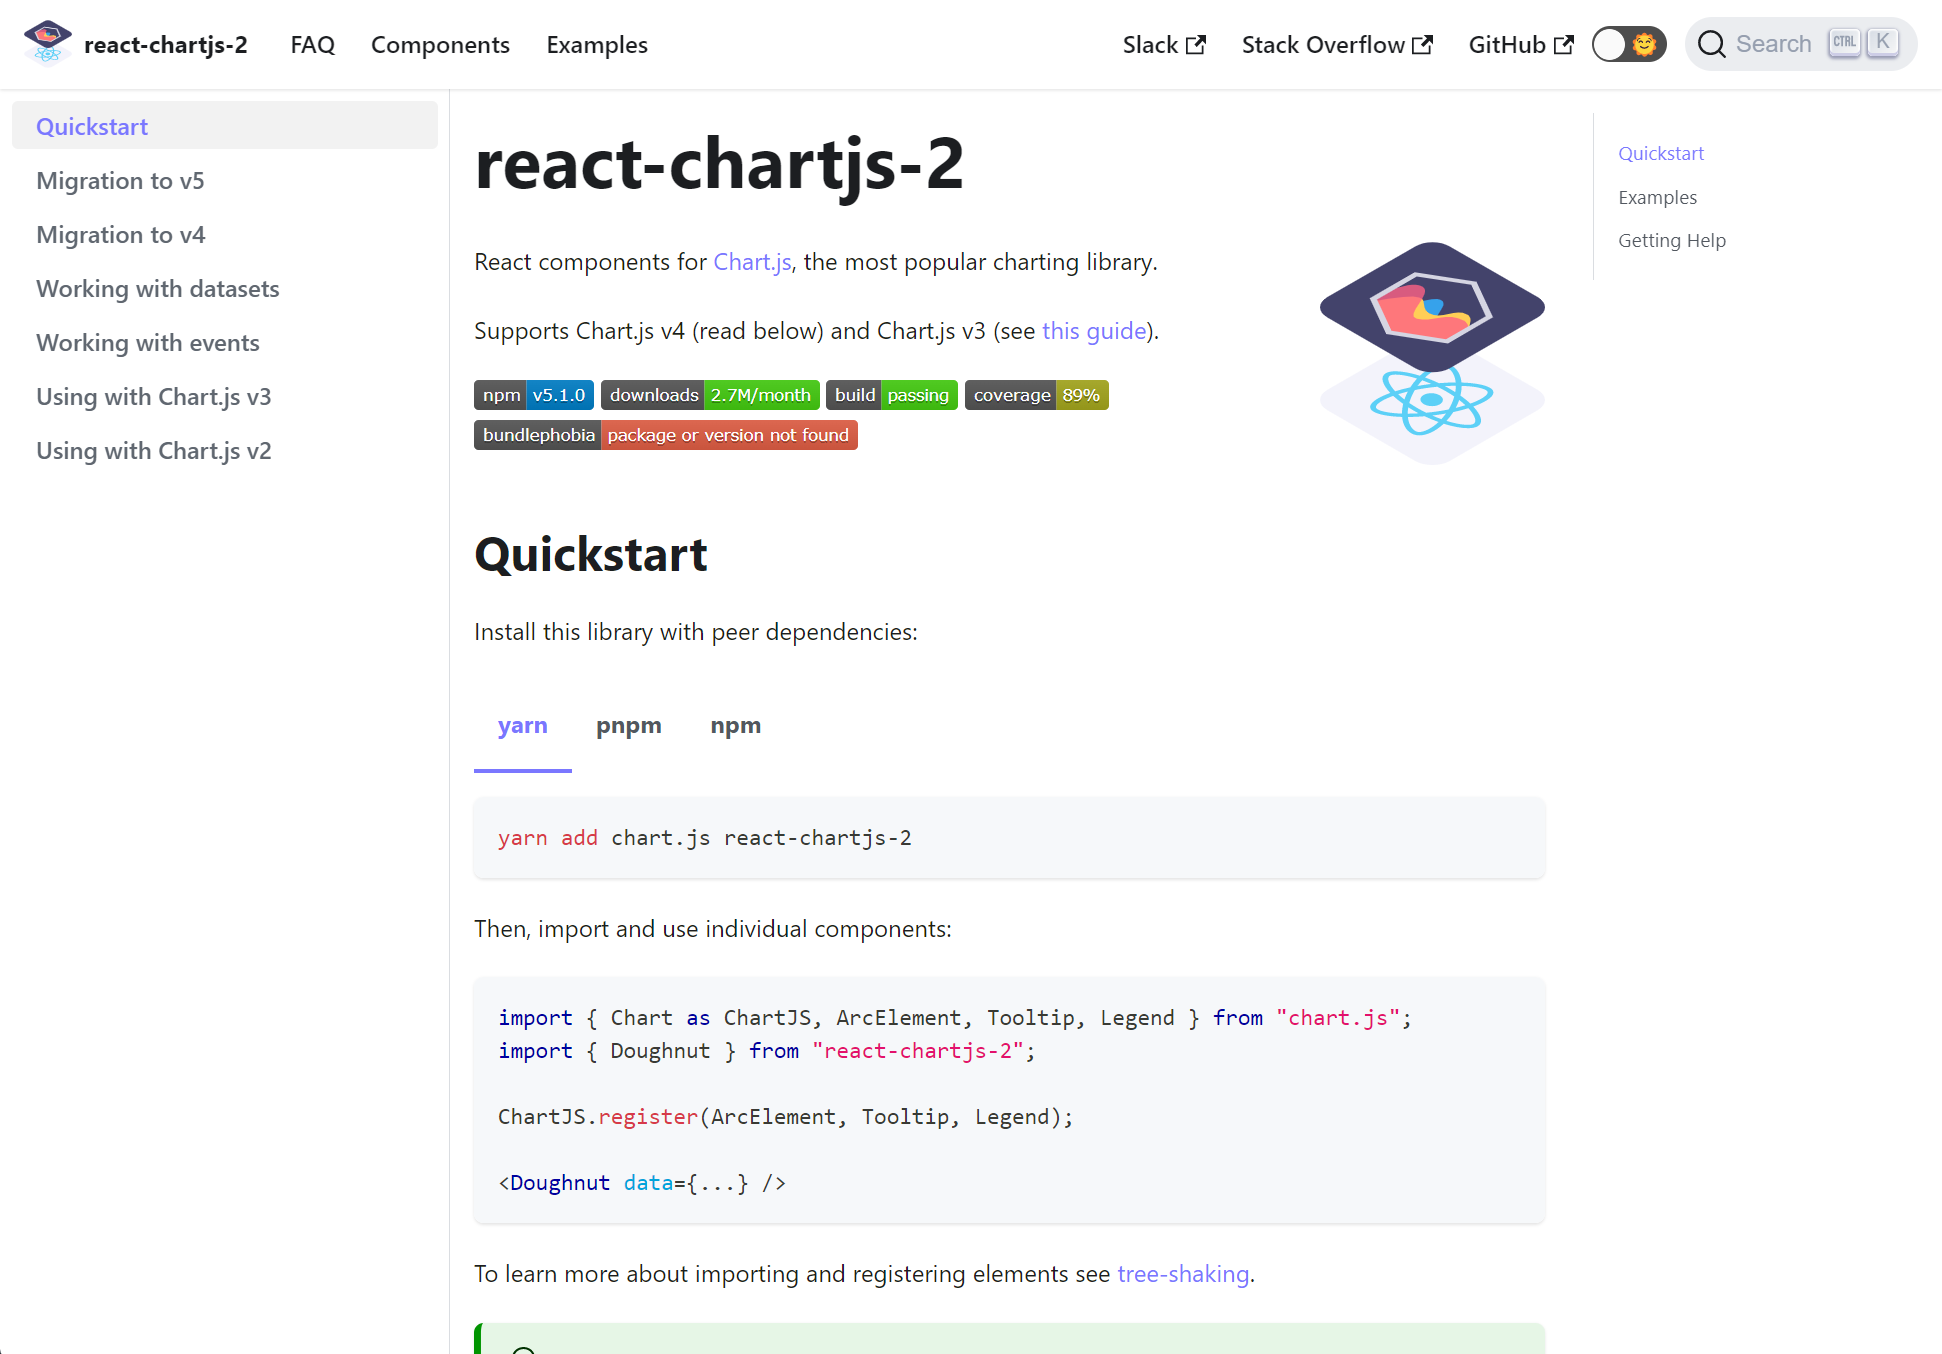
4. React-chartjs-2
| Chart Library Name | Github Stars | Weekly Downloads |
|---|---|---|
| React-chartjs-2 | 5.6k Stars but Chart.js has 59.3k stars | 535,467 |
React-Chartjs-2 is a react charting library that is basically react components from the Chart.js library.
Chart.js according to its website is the most famous javascript charting library.
Here are some of the features of chartjs
Chartjs has built in frequently used chart types, plugins and customizations. There are also community maintained chart types, custom plugins and much more
You can create annotations, zoom, drag and drop functionality to name a few things
Chart.js comes with a good default configuration. Even if you do not do much changes you can get a good looking default chart with animations turned on by default
Apart from react chart.js is also available in Vue, Svelte, Angular. All the chartjs has well maintained wrapper packages that allow for a more native integration with your choice of frameworks
A basic Demo
It is very easy to create a chartjs chart
Install the library with npm
npm install --save chart.js react-chartjs-2Then import the individual components that you need
import { Chart as ChartJS, ArcElement, Tooltip, Legend } from "chart.js";
import { Doughnut } from "react-chartjs-2";

ChartJS.register(ArcElement, Tooltip, Legend);

<Doughnut data={...} />
5.Visx
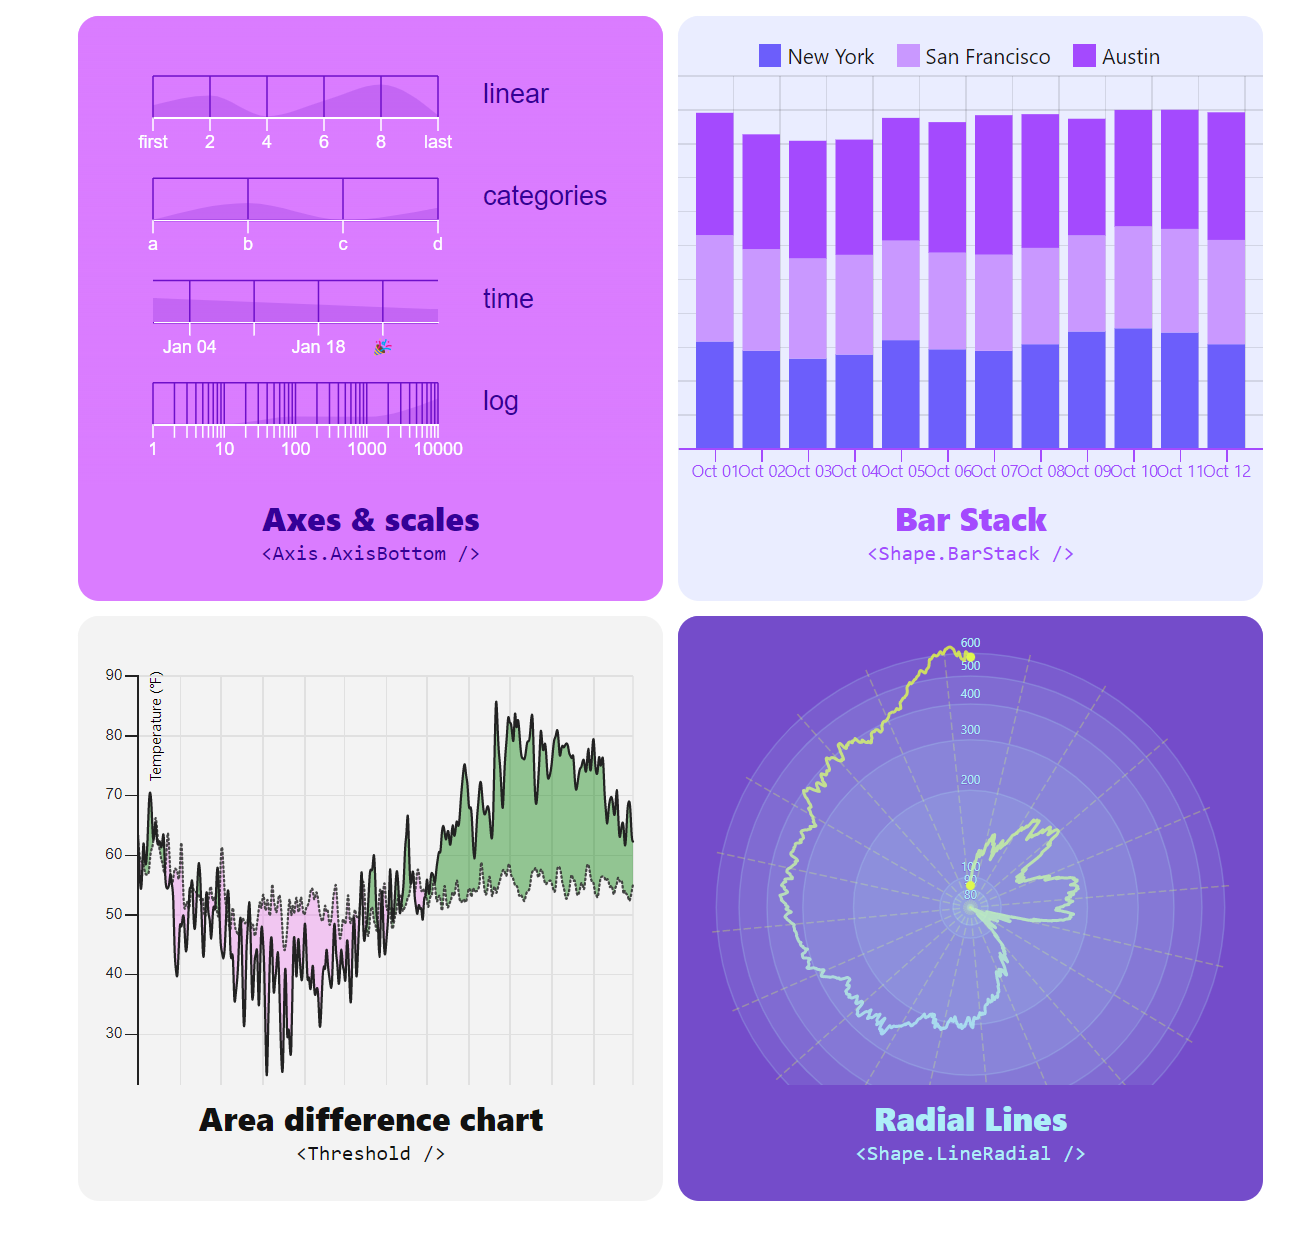
Visx is a collection of visualization privatives by airbnb.
| Chart Library Name | Github Stars | Weekly Downloads |
|---|---|---|
| airbnb Visx | 16.5k | 7,907 |
Here are the features of Visx
- Small size: Multiple packages are available start small and use what you need
- Un-opinioned: Use your owb state management, library and CSS
- Not a charting library: These are only visualization primatives and not a library
- Based completely on react
Visx is completely customizable, You need a glyph install the glyph and you need a shape or a grid install that only
A basic demo
In this demo we are going to import the Visx grid. The Visx grid package lets you create gridlines for charts
<GridRows /> render horizontally and the <Gridcolumns /> render vertically you can render them both using the <Grid />
import { Grid } from '@visx/grid';
// or
// import * as Grid from '@visx/grid';
// <Grid.Grid />

const grid = (
  <Grid
    xScale={xScale}
    yScale={yScale}
    width={xMax}
    height={yMax}
    numTicksRows={numTicksForHeight(height)}
    numTicksColumns={numTicksForWidth(width)}
  />
);

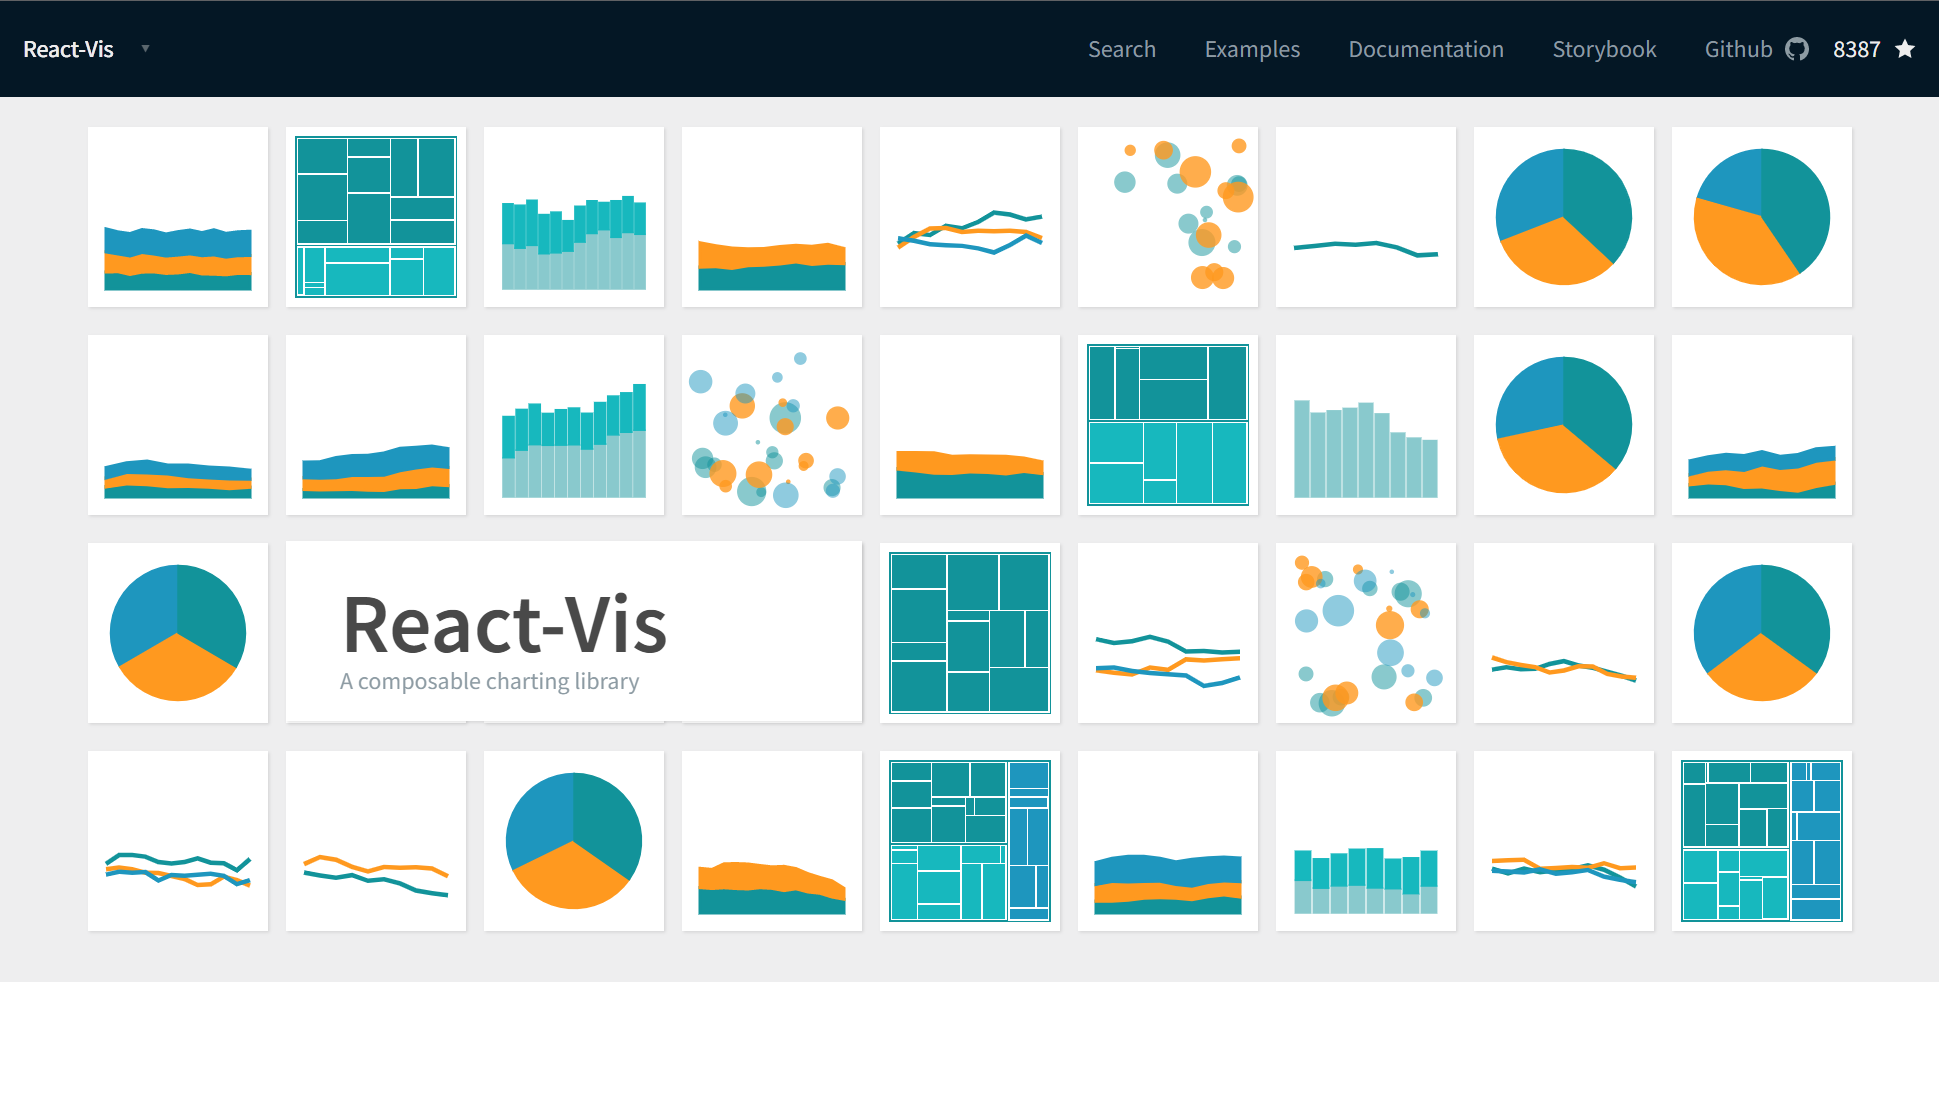
6. React-Vis
| Chart Library Name | Github Stars | Weekly Downloads |
|---|---|---|
| React-vis | 8.3k Stars | 55,524 |
React-vis library is pretty old and has not been updated since last 4 years but it still works just fine.
React-vis is a react based virtualization library. It has the following features
- Based on react. React-vis has react components and props and children and callbacks
- Easily create complex charts with minimum amount of code but can also be customized
- Everything from line charts to area maps can be created using React Vis
A basic Demo
Easily install the react Vis using the npm
npm install react-visAdding react-vis to your project
import React, { Component } from 'react';
import './App.css';
import '../node_modules/react-vis/dist/style.css';
import {XYPlot, LineSeries} from 'react-vis';

class App extends Component {
  render() {
    const data = [
      {x: 0, y: 8},
      {x: 1, y: 5},
      {x: 2, y: 4},
      {x: 3, y: 9},
      {x: 4, y: 1},
      {x: 5, y: 7},
      {x: 6, y: 6},
      {x: 7, y: 3},
      {x: 8, y: 2},
      {x: 9, y: 0}
    ];
    return (
      <div className="App">
        <XYPlot height={300} width={300}>
          <LineSeries data={data} />
        </XYPlot>
      </div>
    );
  }
}

export default App;Every react-vis chart is inside a component called XYPlot for which a height and width must be specified
<XYPlot height={300} width = {300} />And all the elements that are a part of the chart are children of the XYPlot
const data = [
  {x: 0, y: 8},
  {x: 1, y: 5},
  {x: 2, y: 4},
  {x: 3, y: 9},
  {x: 4, y: 1},
  {x: 5, y: 7},
  {x: 6, y: 6},
  {x: 7, y: 3},
  {x: 8, y: 2},
  {x: 9, y: 0}
];
<XYPlot height={300} width= {300}>
  <VerticalGridLines />
  <HorizontalGridLines />
  <XAxis />
  <YAxis />
  <LineSeries data={data} />
</XYPlot>
Conclusion
In this article I explained the famous react charting libraries along with their features and a basic demo on how to use them.
I hope this article helps you in deciding which library to use in your react project
This article is brought to you by DeadSimpleChat
Ready to Add Chat to Your Website?
Get started for free. No credit card required.
Start a Free Trial
![Webinar Chat: The Complete Guide to Engaging Your Audience [2026]](/blog/content/images/size/w600/2026/02/article-hero-webinar-chat.svg)