A complete guide to debugging react native applications
Dead Simple Chat offers prebuilt Chat that can be added in minutes to any app or website. Can be completely customized and offers powerful react native Chat SDK
In this guide we will learn how to debug a react native applications and the set of debugging tools available for us.
Debugging Expo Apps
Refer to this section if you want to debug the react native app using Expo. If you are already familiar with Expo you can skip to Step 3.
Step 1: Setting up expo app
For this debug demo we will create a basic expo application, with a button and we want to pause the debugger when the button is pressed.
To create the app we will type the following command:
npx create-expo-app react-native-expo
react-native-expo is the name of the app we want to create, you can change it to anything you like.
Once the app is created we will cd into the app directory
cd react-native-expoStep 2: Running the application
Once our app is created, we will cd into app directory and run the application, to start the expo app we will type the following command:
npm run start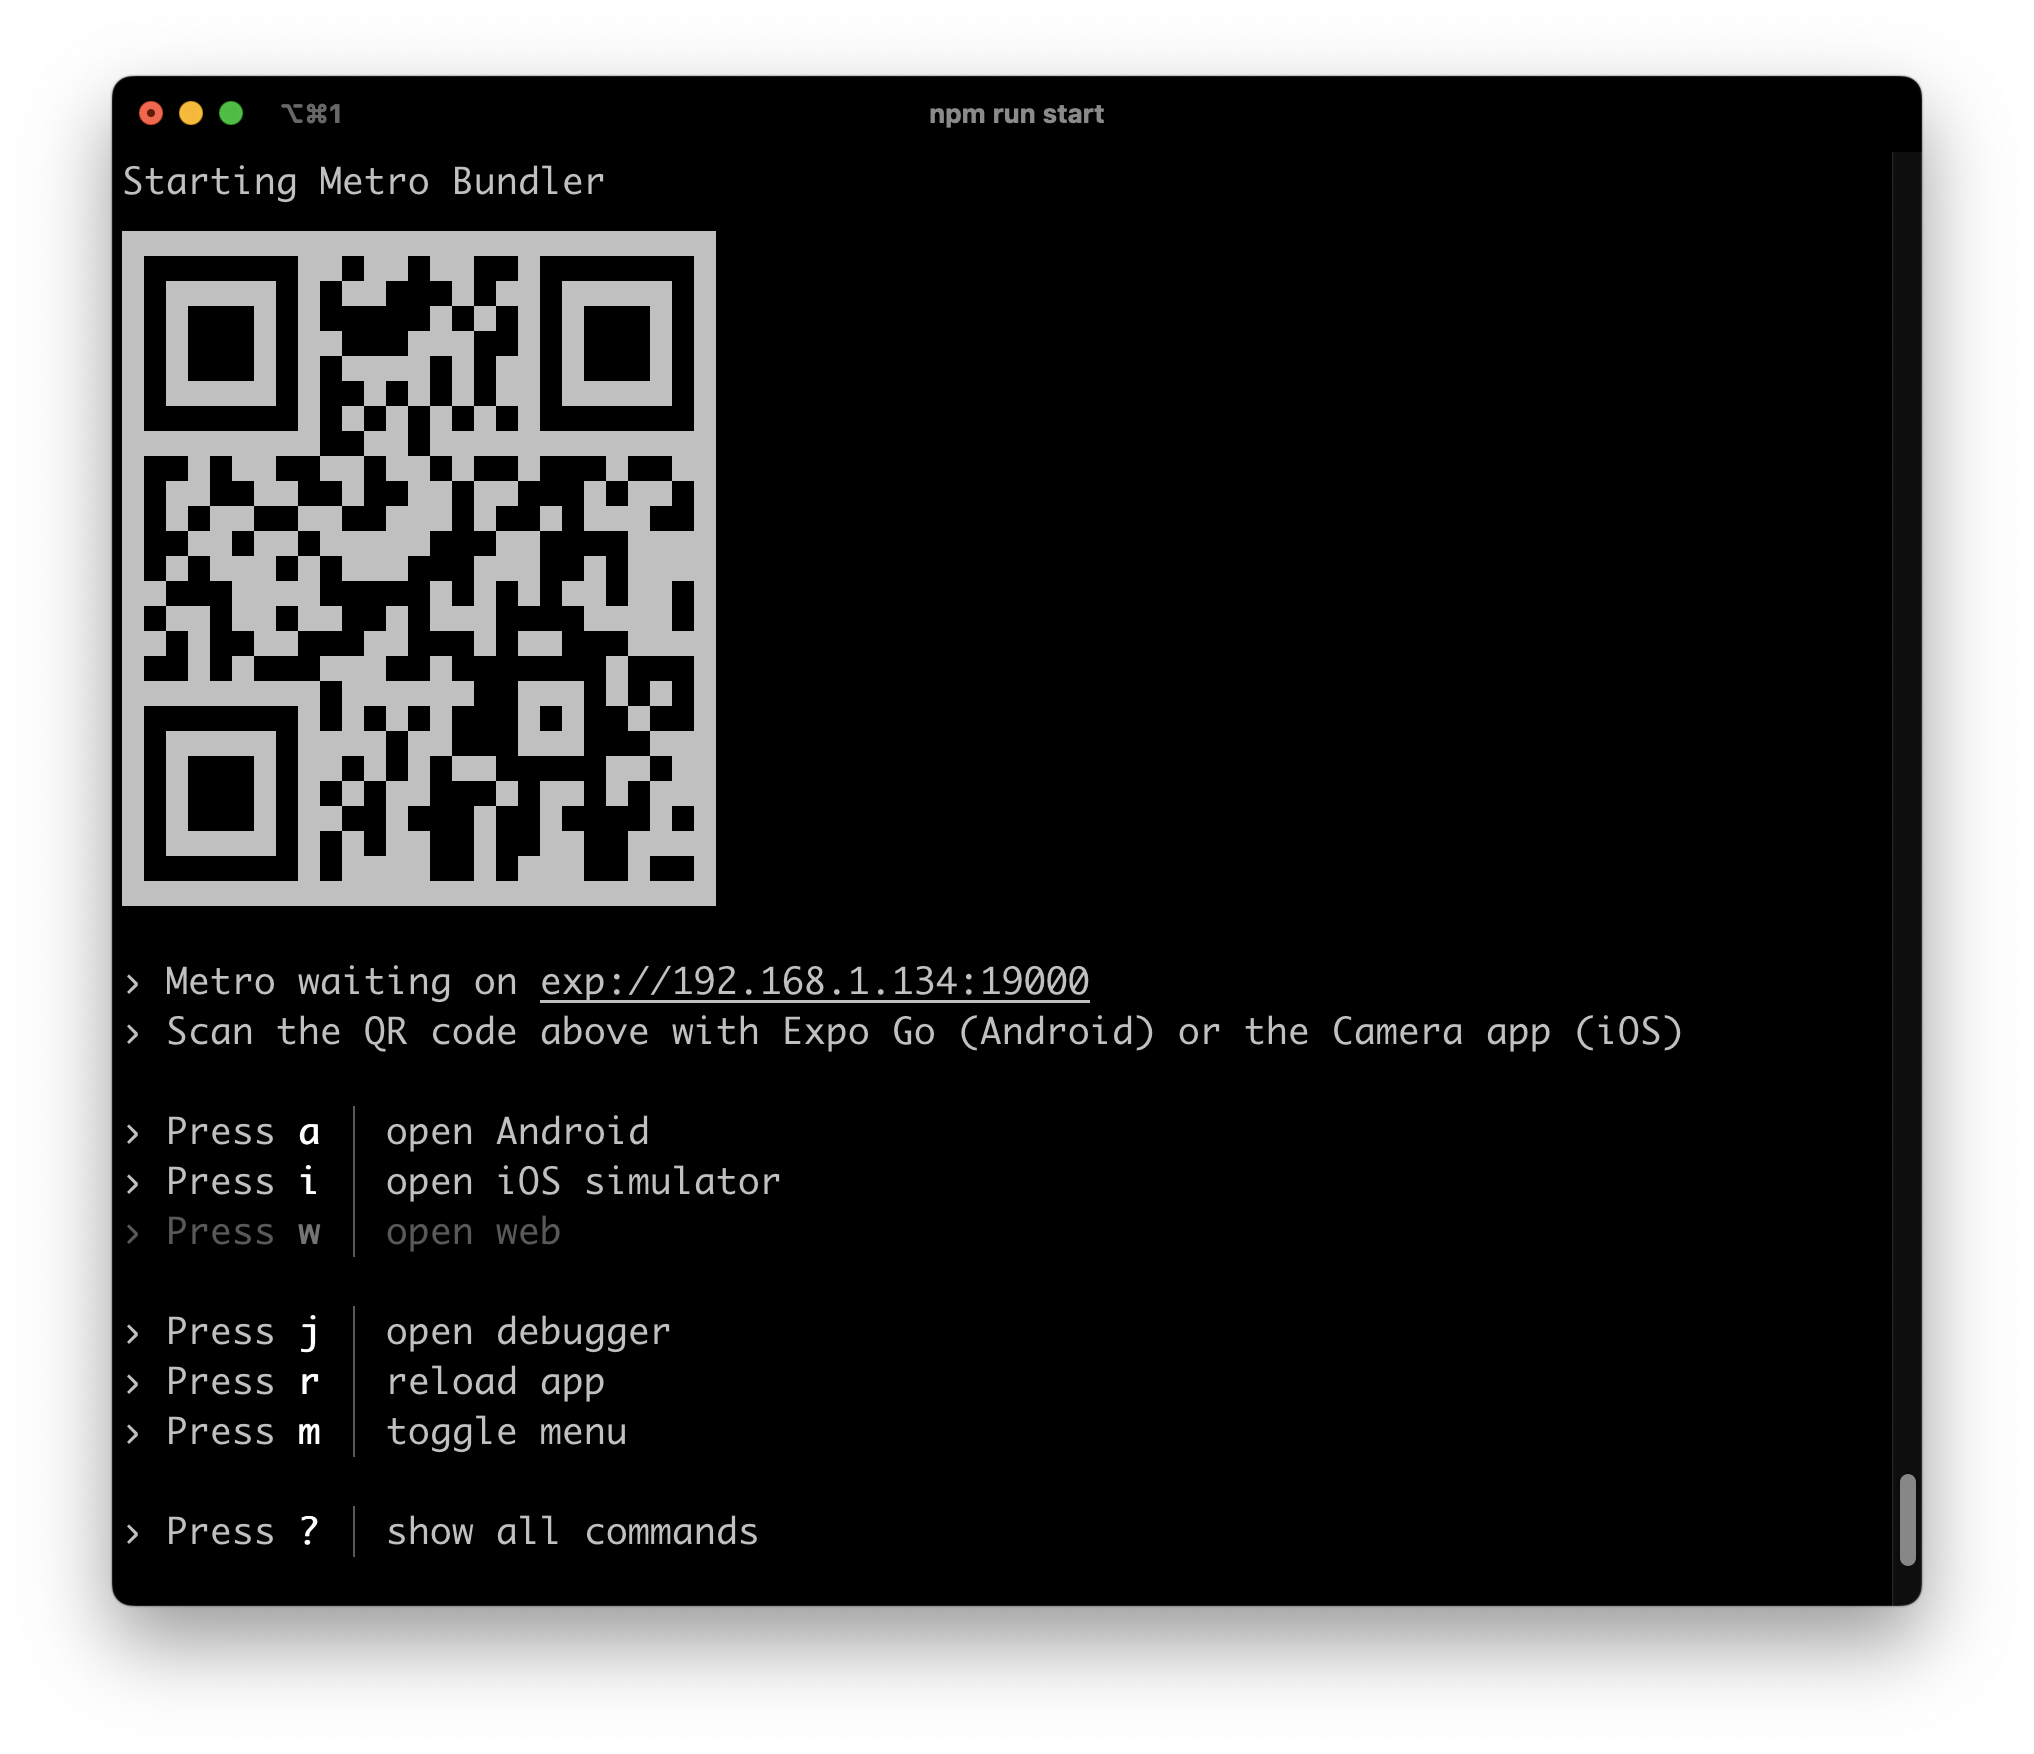
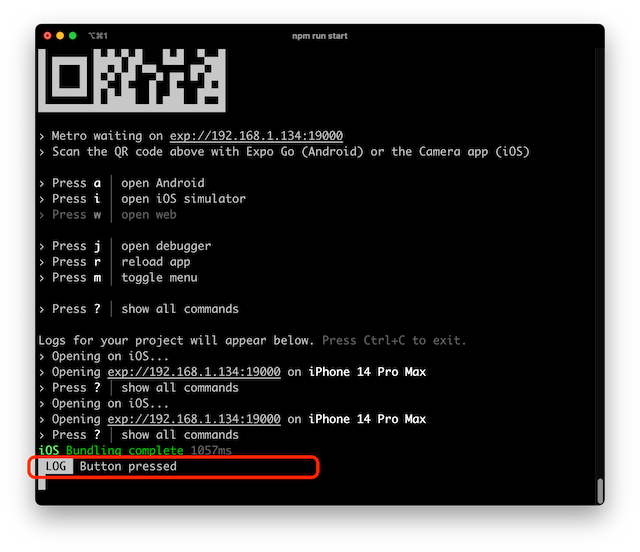
This will launch the Metro bundler. The Metro bundler allows us to run the application in multiple ways.
The easiest way is to run the app on your mobile device. To run the app on your mobile device go apple App Store or Google Play store and search for "Expo Go" application
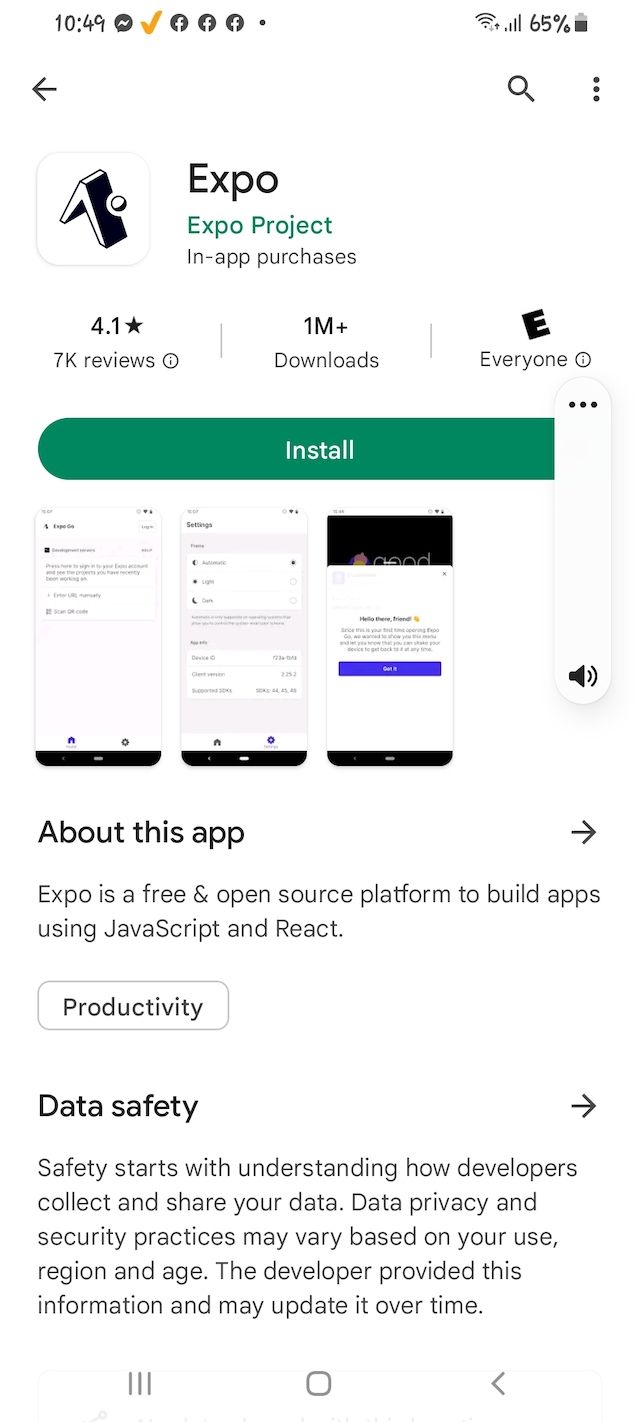
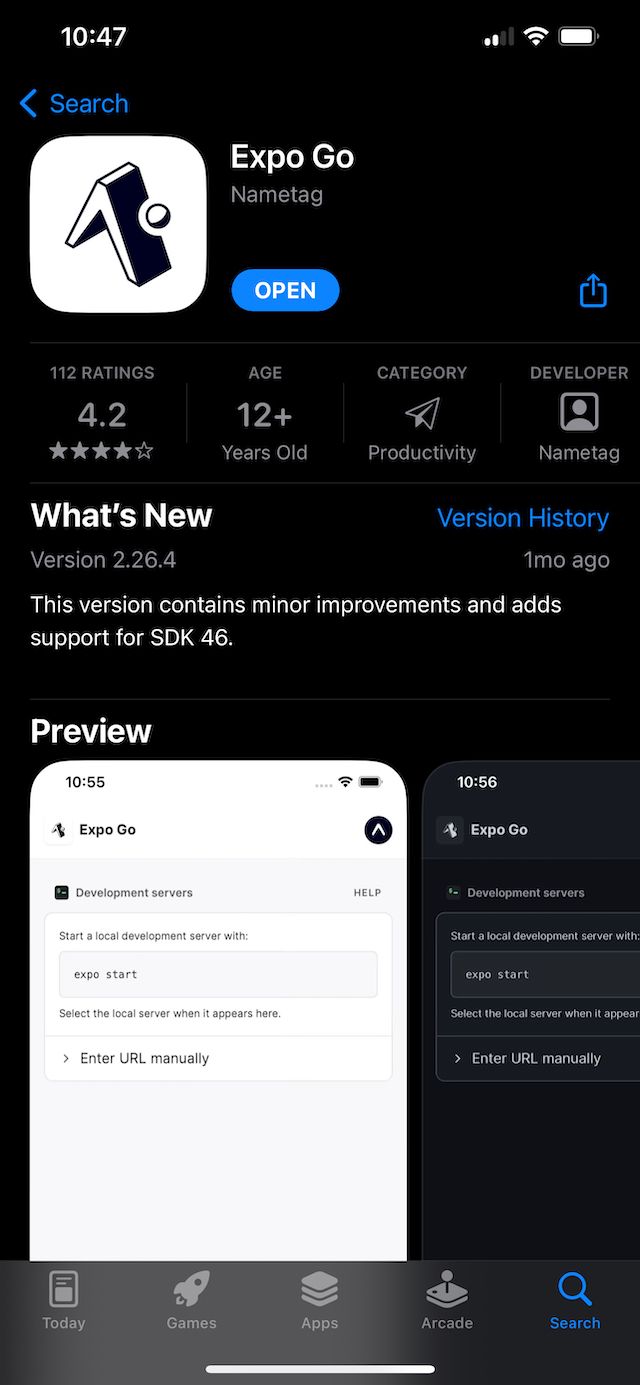
Once the app is installed, launch the camera app on your phone and scan the QR Code displayed on the terminal window.
After scanning the QR Code, you app will launch inside the "Expo Go" application.
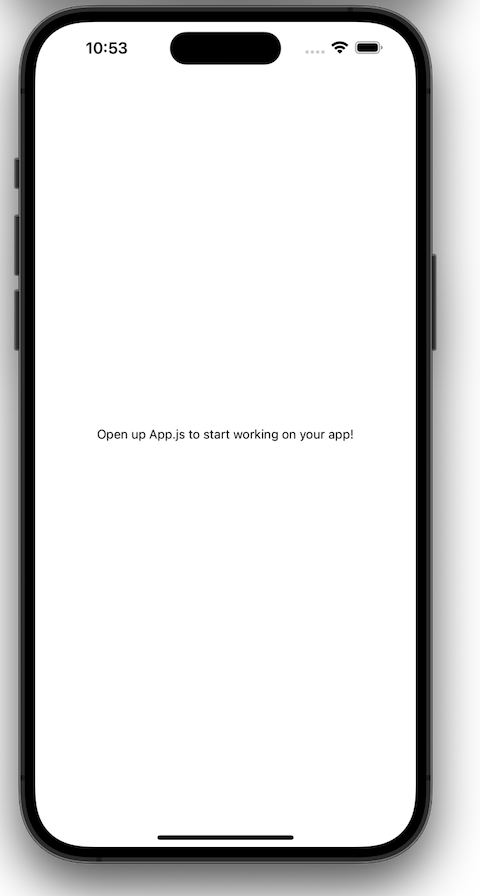
Now when you change the code in your app, the Expo Go application will automatically refresh.

Step 3: Creating a button
Now we will edit the Expo app created by the cli and a button, want to call a function when this button is pressed, and in the later steps we will add a debugger to the function.
To edit the button we will open the project in vscode, the easiest way to open the project in VSCode is running the code . command.
Make sure you can in the code directory and in the terminal type the command:
code .This will open the project in VSCode, now inside VSCode open the file App.js
We will edit the App.js file and add the following code:
import { StatusBar } from 'expo-status-bar';
import { StyleSheet, Text, View, Button } from 'react-native';

export default function App() {
  return (
    <View style={styles.container}>
      <Text>Debugging Demo</Text>
       <Button
          onPress={buttonPressed}
          title="Learn More"
          color="#841584"
          accessibilityLabel="Learn more about this purple button"
        />
      <StatusBar style="auto" />
    </View>
  );
}

function buttonPressed() {
  console.log("Button pressed");
}

const styles = StyleSheet.create({
  container: {
    flex: 1,
    backgroundColor: '#fff',
    alignItems: 'center',
    justifyContent: 'center',
  },
});
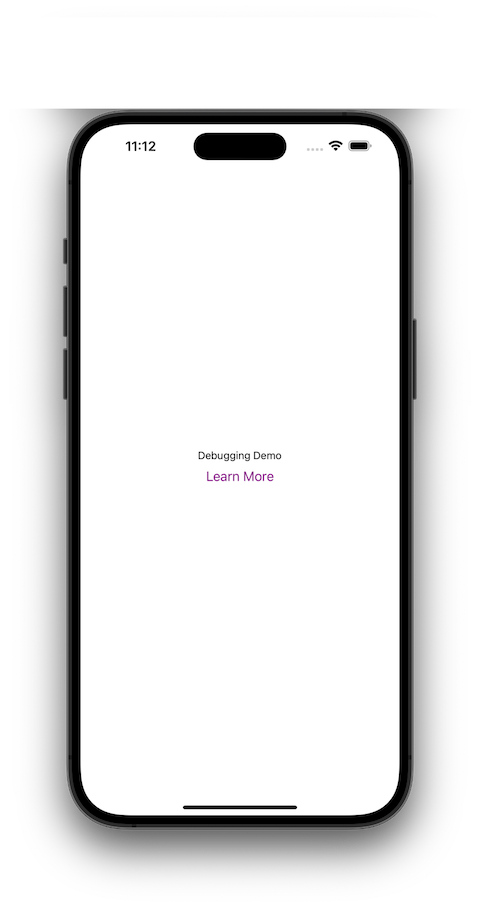
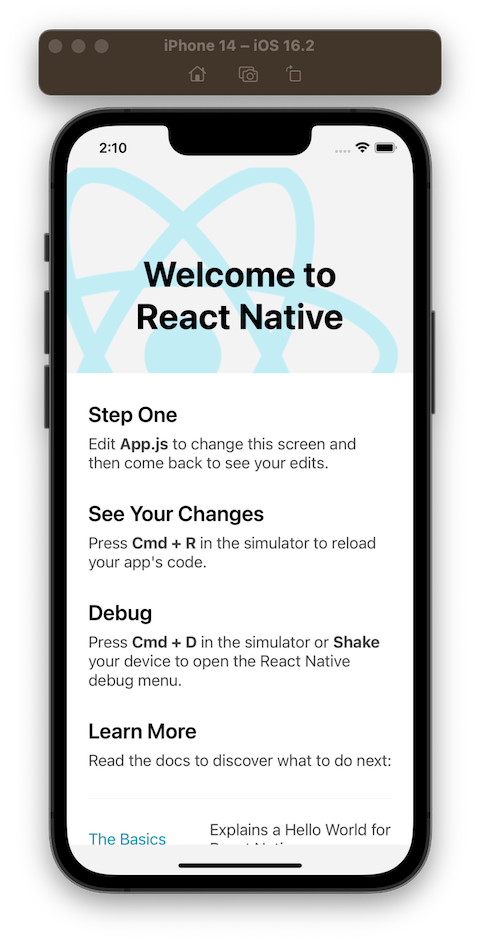
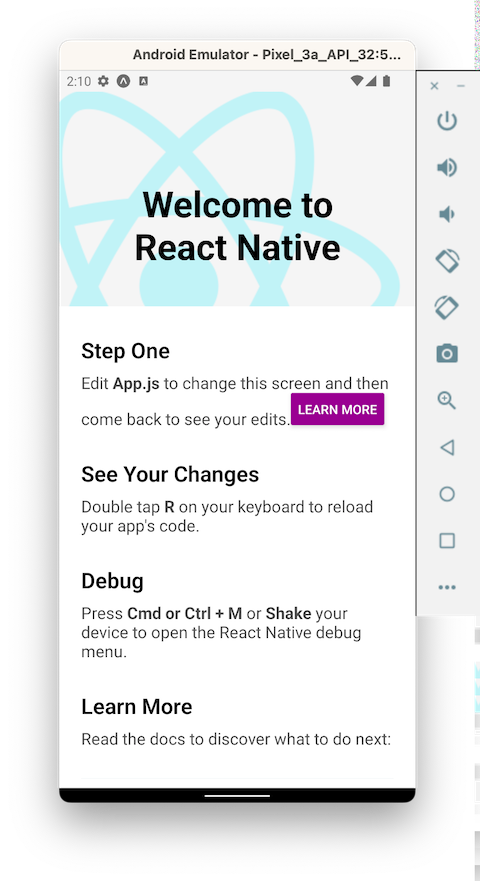
We have added a "Learn More" button and when the button is pressed, we can see the log message in the terminal on our computer.
Now close the Metro Bundler terminal application by press Cltr+c command.
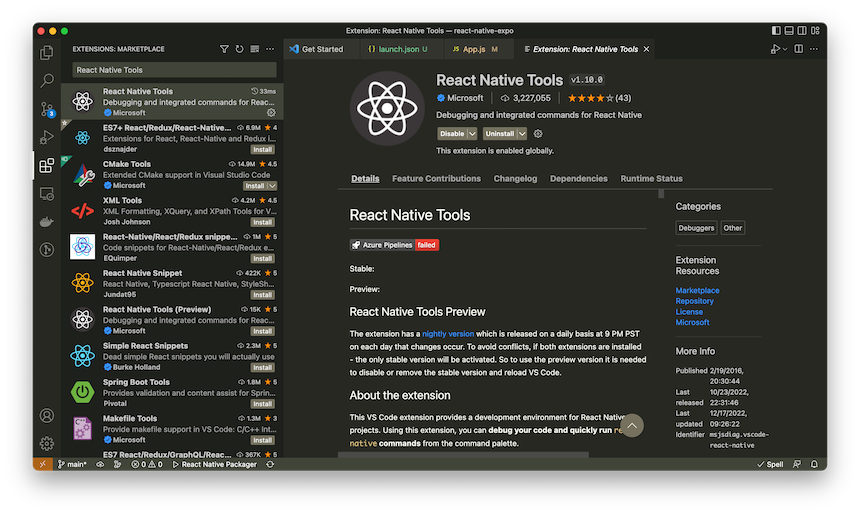
Step 4: Installing React Native VSCode Debug Extension
Our goal is to pause the debugger in VSCode when the button is pressed, to do this we will install the React Native VSCode Debug extension.
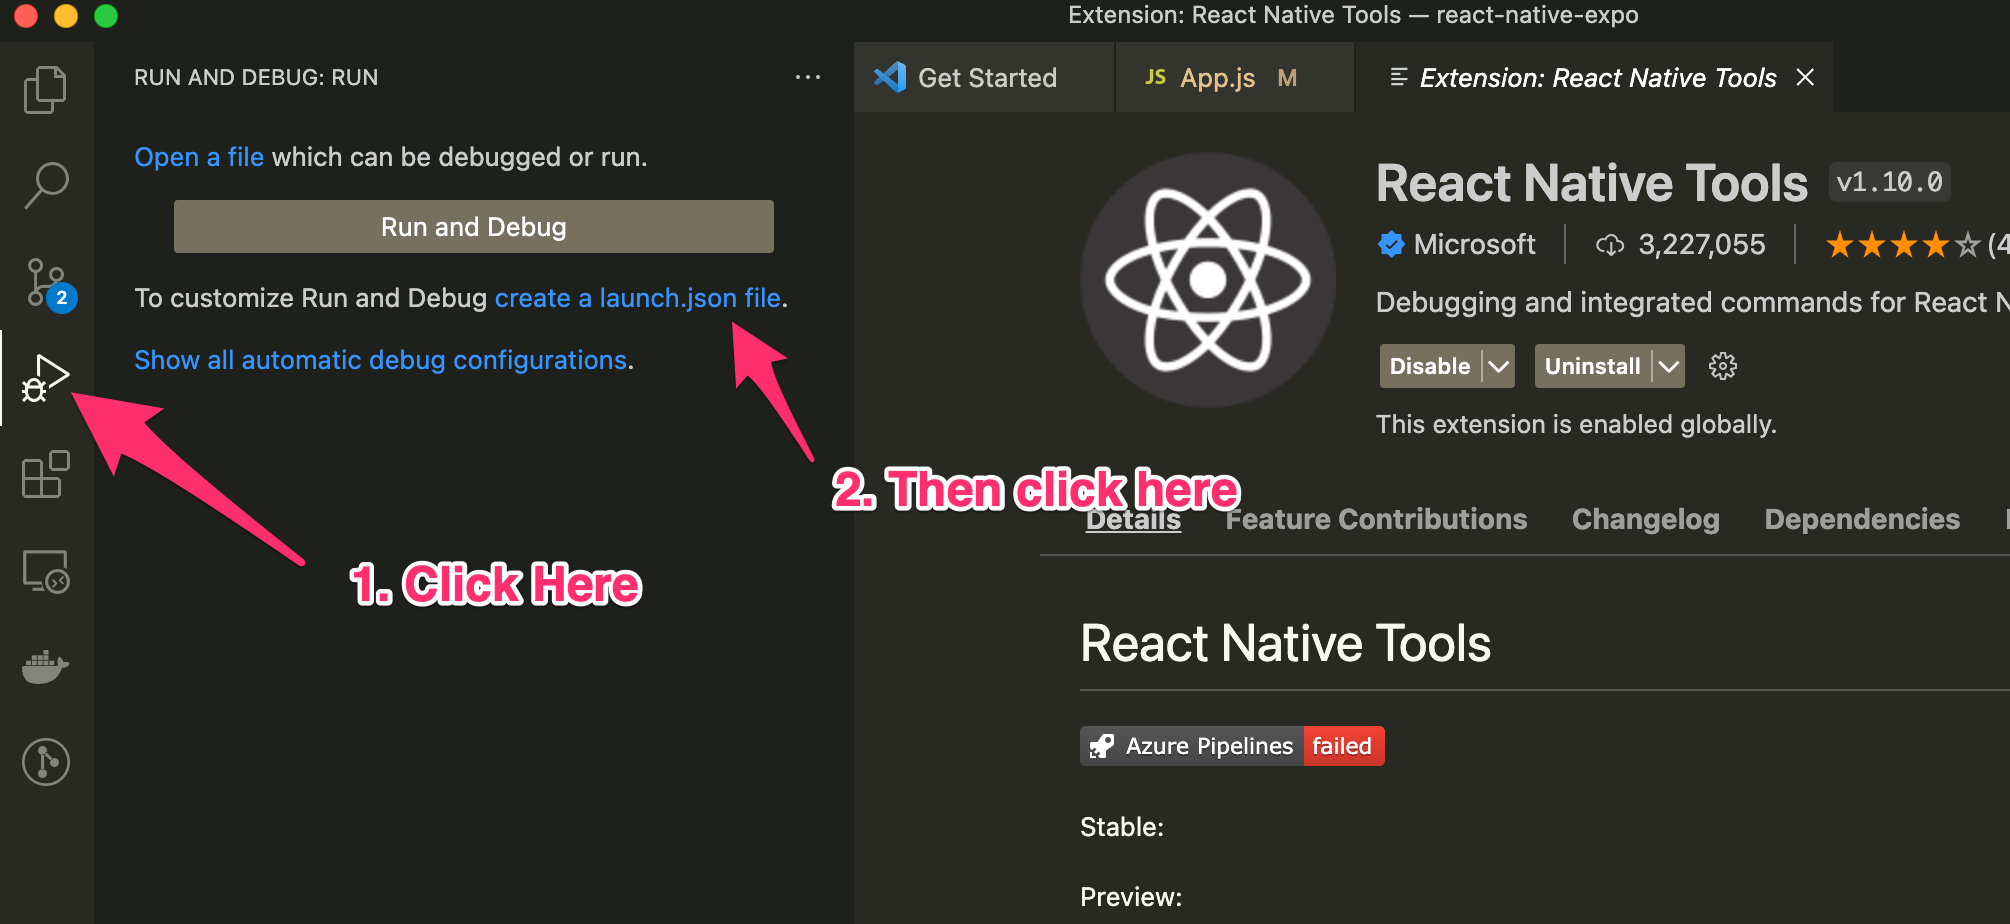
Step 5: Setting up the Extension to Debug Expo Apps
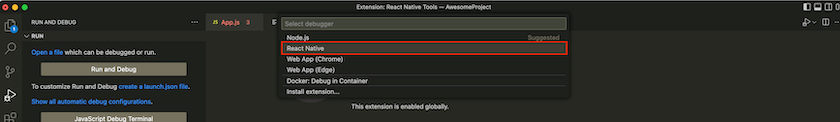
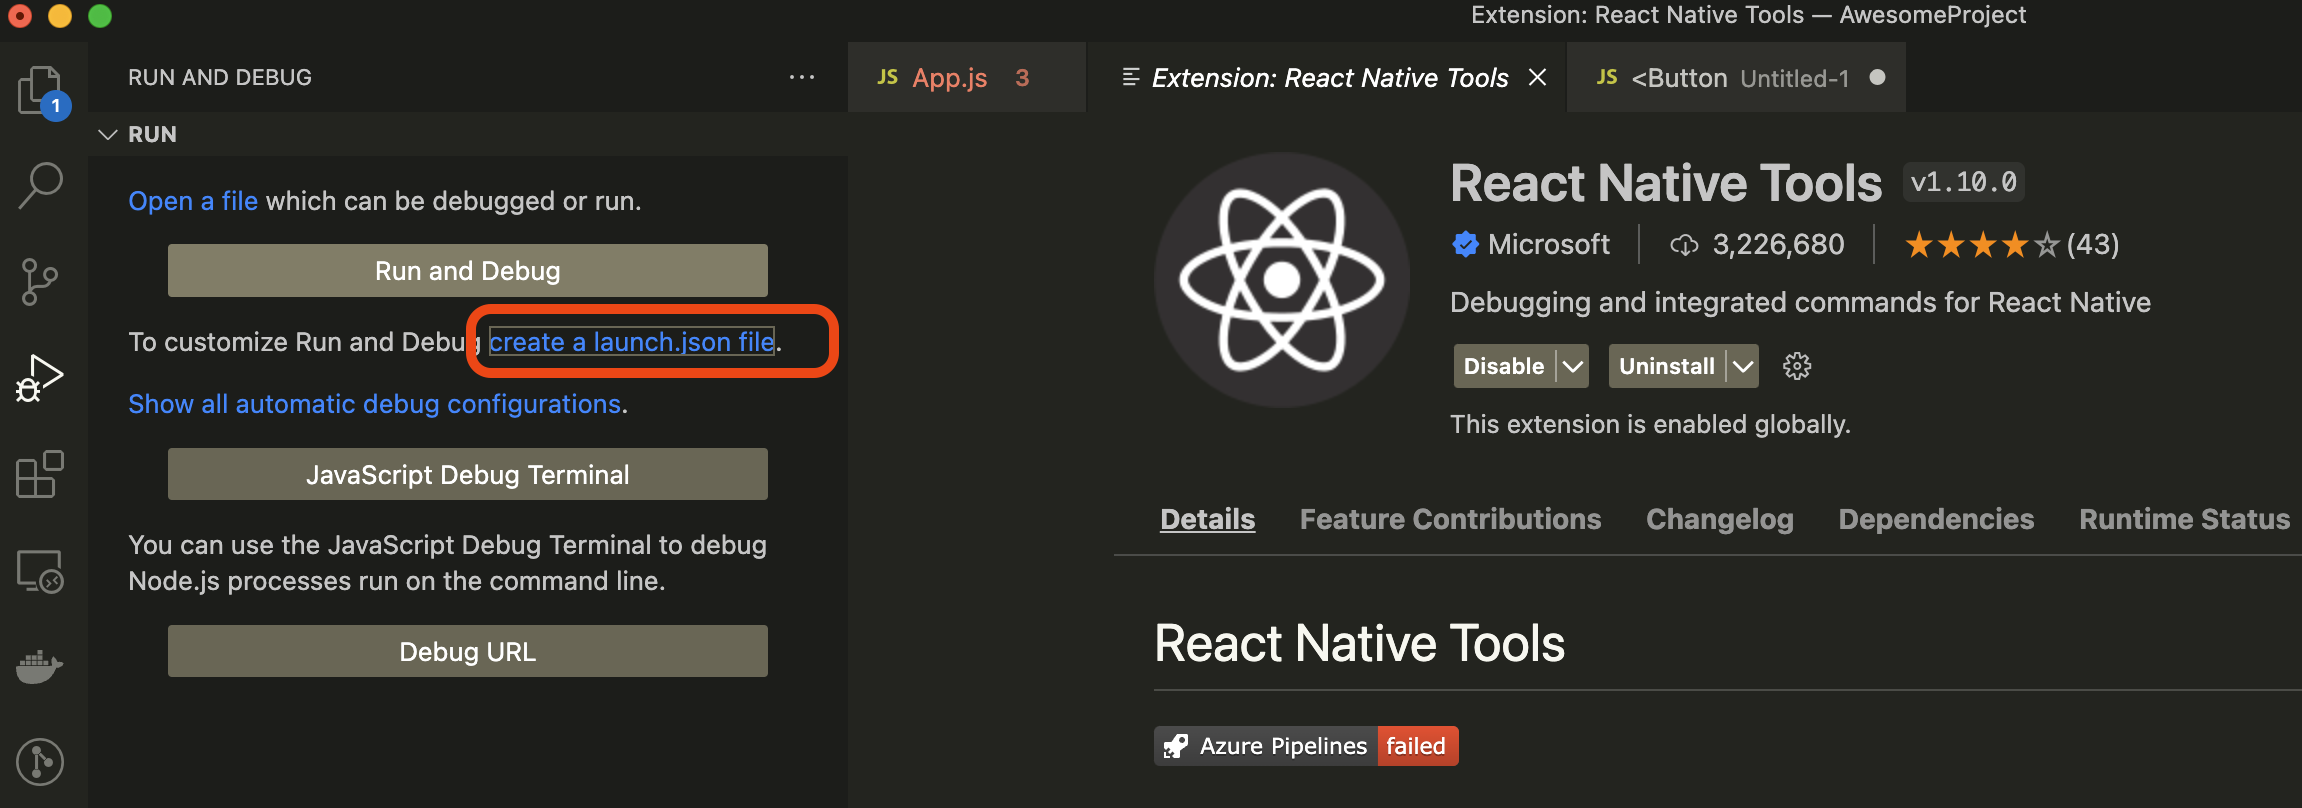
Once the extension is installed go to the run and debug menu by clicking this button on the sidebar, and then click on "create a launch.json file" link.
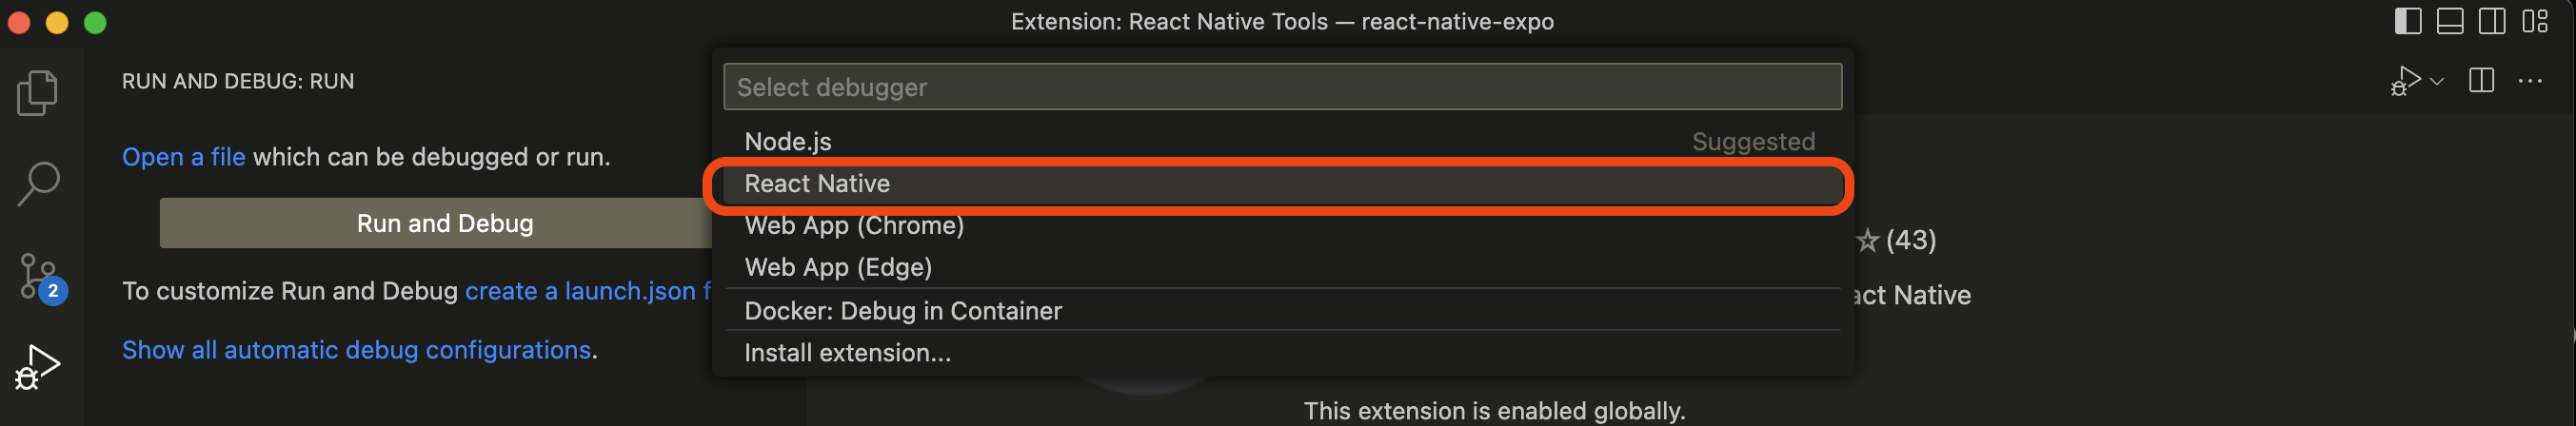
Then Select "React Native" from the list

Then another menu will appear, in the new menu makes sure everything is unchecked, and only "Debug in Exponent" is checked, as shown in the image below.
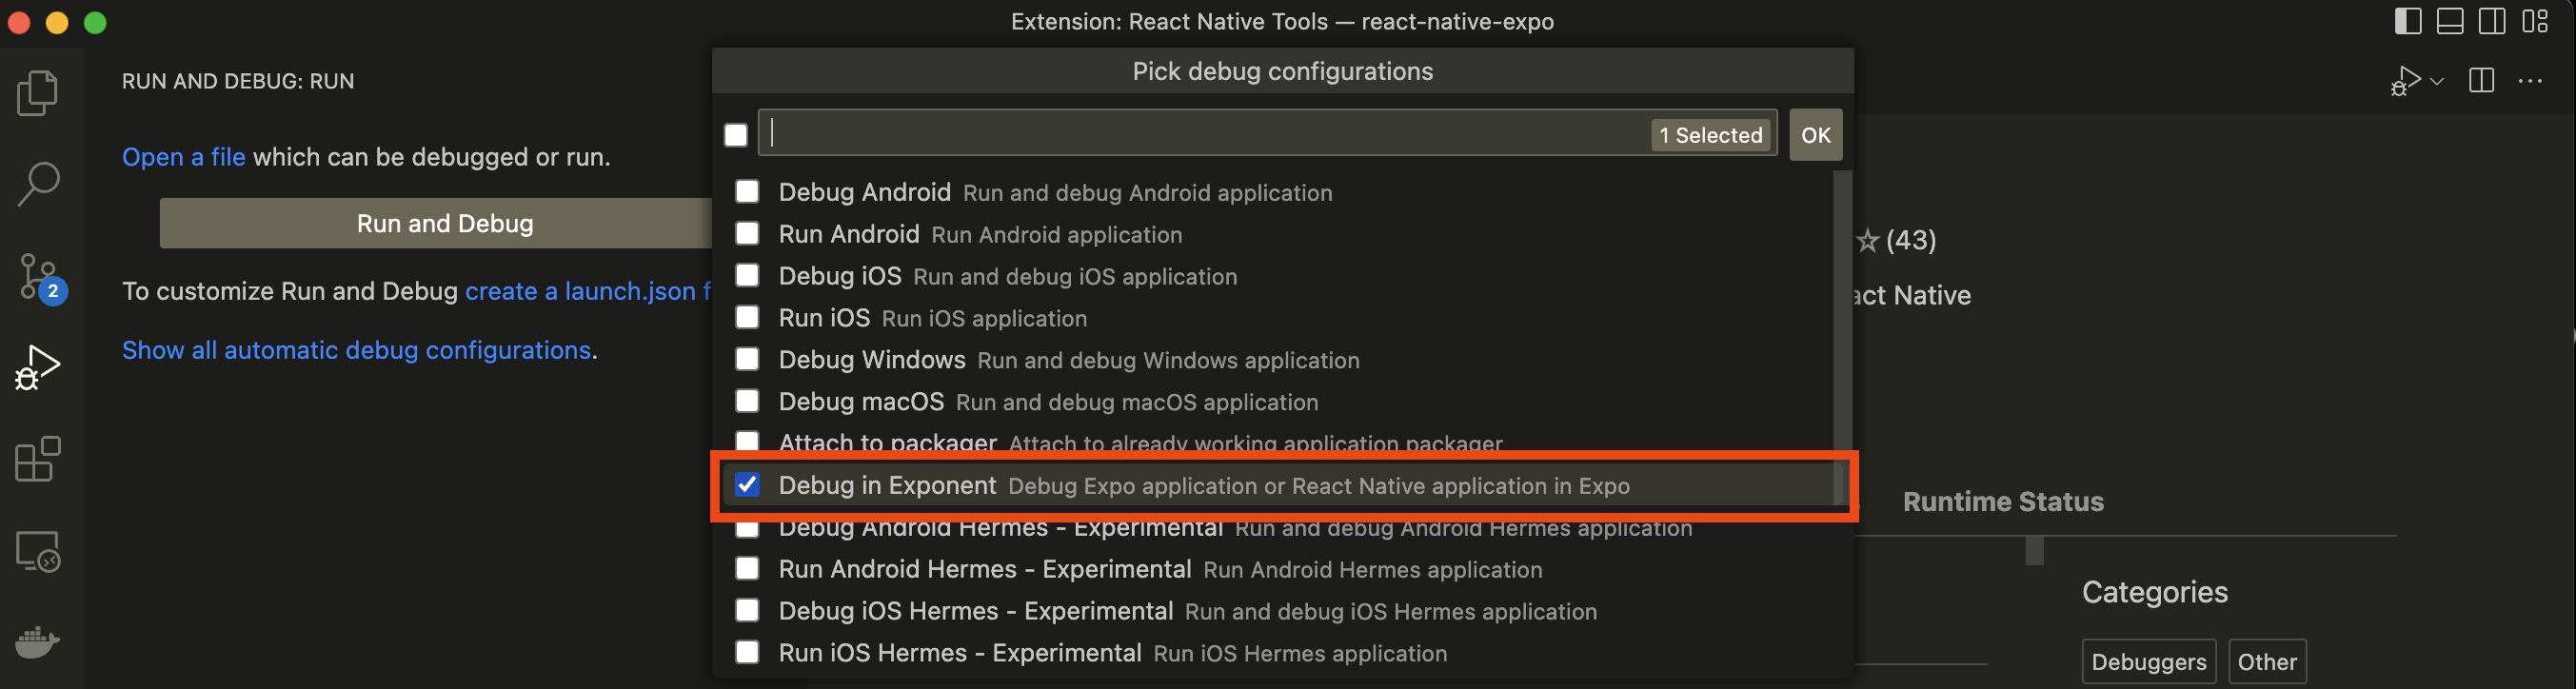
Then click the "OK" button and it will automatically create a launch.json file and in the debug menu "Debug in Exponent" option will be visible.
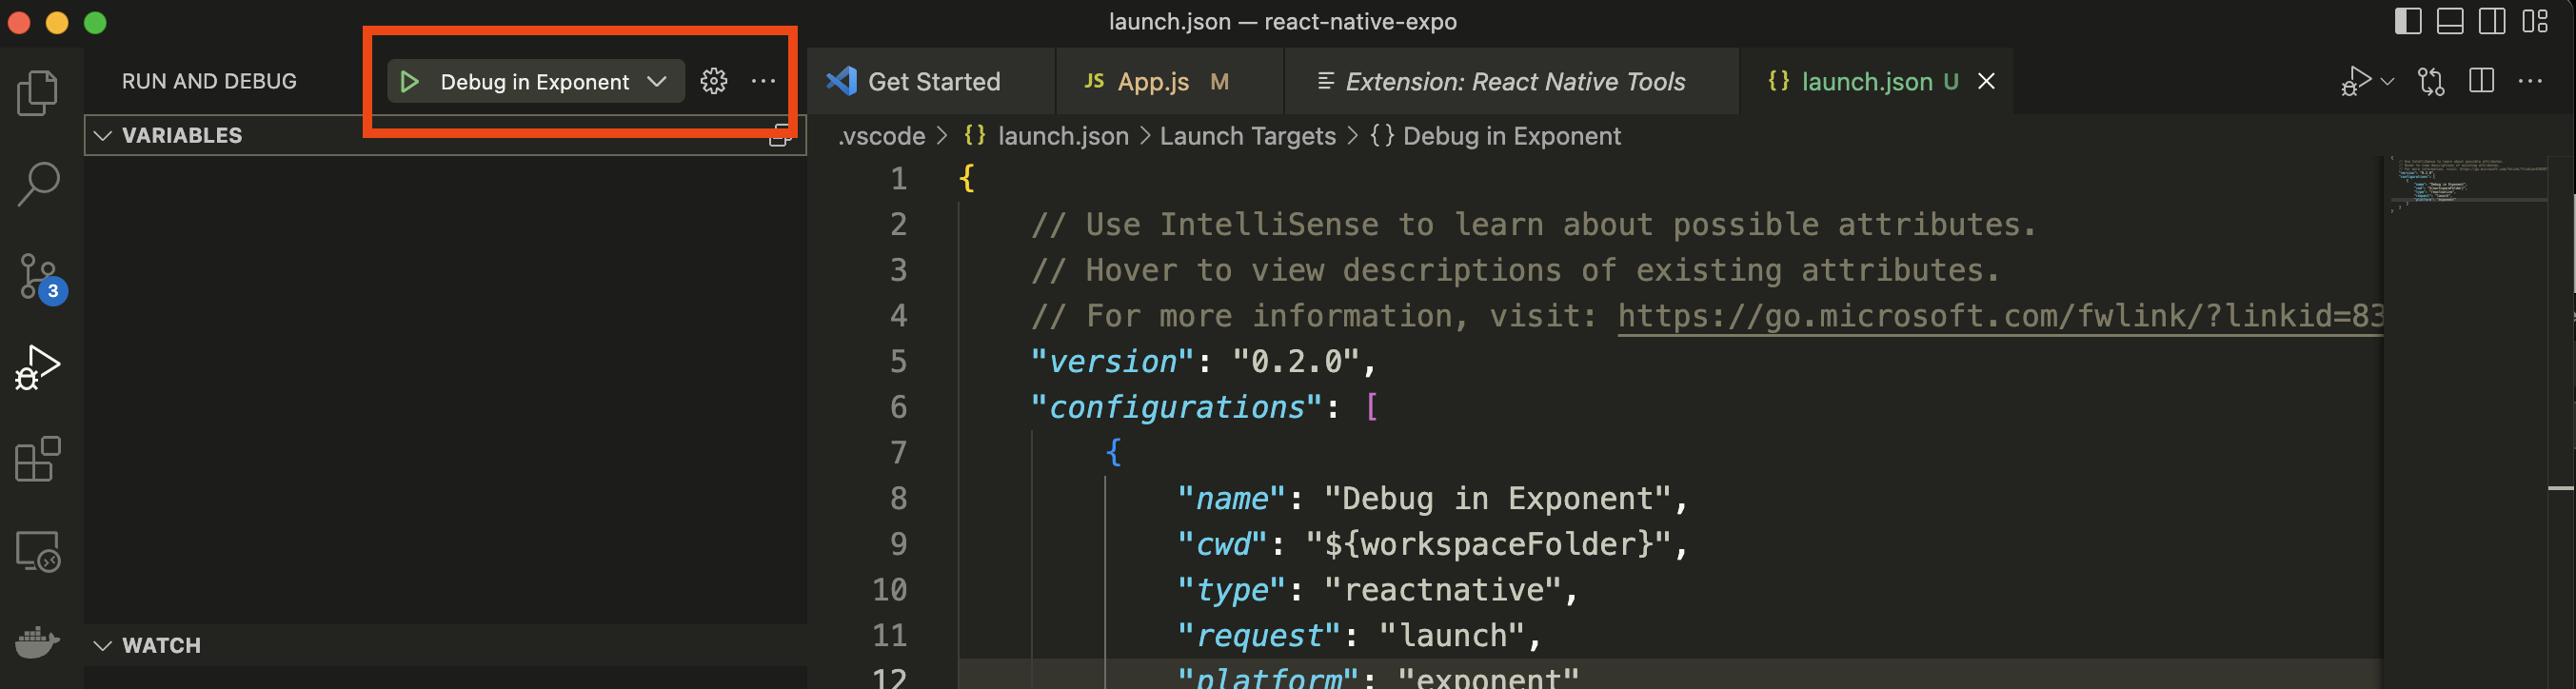
Step 6: Launching the Debugger
To start debugging the application we will click on "Start Debugging" button where "Debug in Exponent" is written.
Before launching this make sure that Metro bundler is not running in the terminal, if it is running close it using Cltr+c.
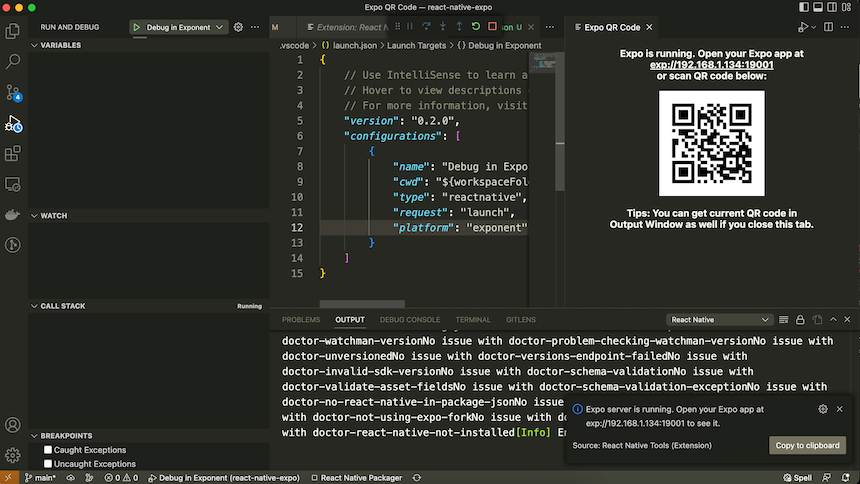
Once you launch it, it will show the qr code, just scan the qr code on your mobile device to launch the app in the Expo Go application.
Step 7: (Important) Enable Remote Debugging
Now an important step remains, without this your debugger will not work.
You will have to enable remote debugging the Expo app.
iOS Device: If you are running the Expo App on iOS then Shake your iOS device to reveal the "In-App Developer Menu".
iOS Emulator: If the app is running in the iOS Emulator Device -> Shake option
Android Device: If you are running the Expo App on Android then Shake your Android device to reveal the "In-App Developer Menu".
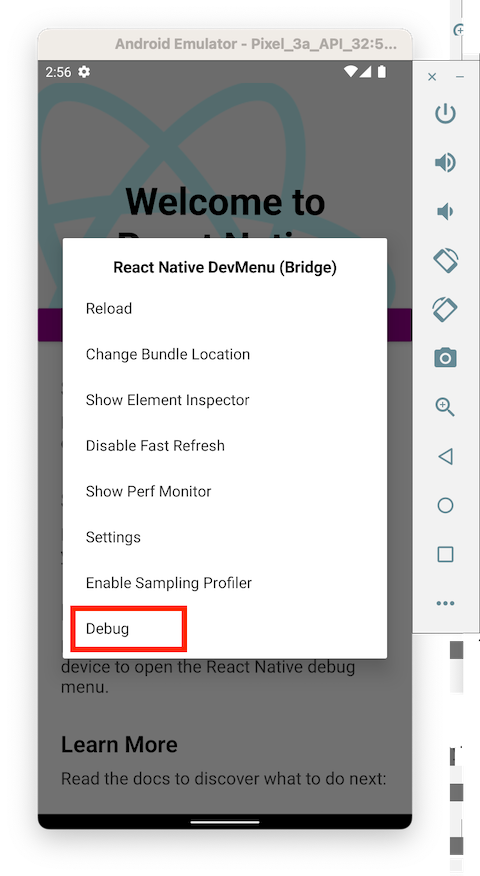
Android Emulator: If the app is running in Android Emulator then press Cmd+M or Cltr+M button.
Once you have launched the "In-App Developer Menu" select "Debug Remote JS" option.
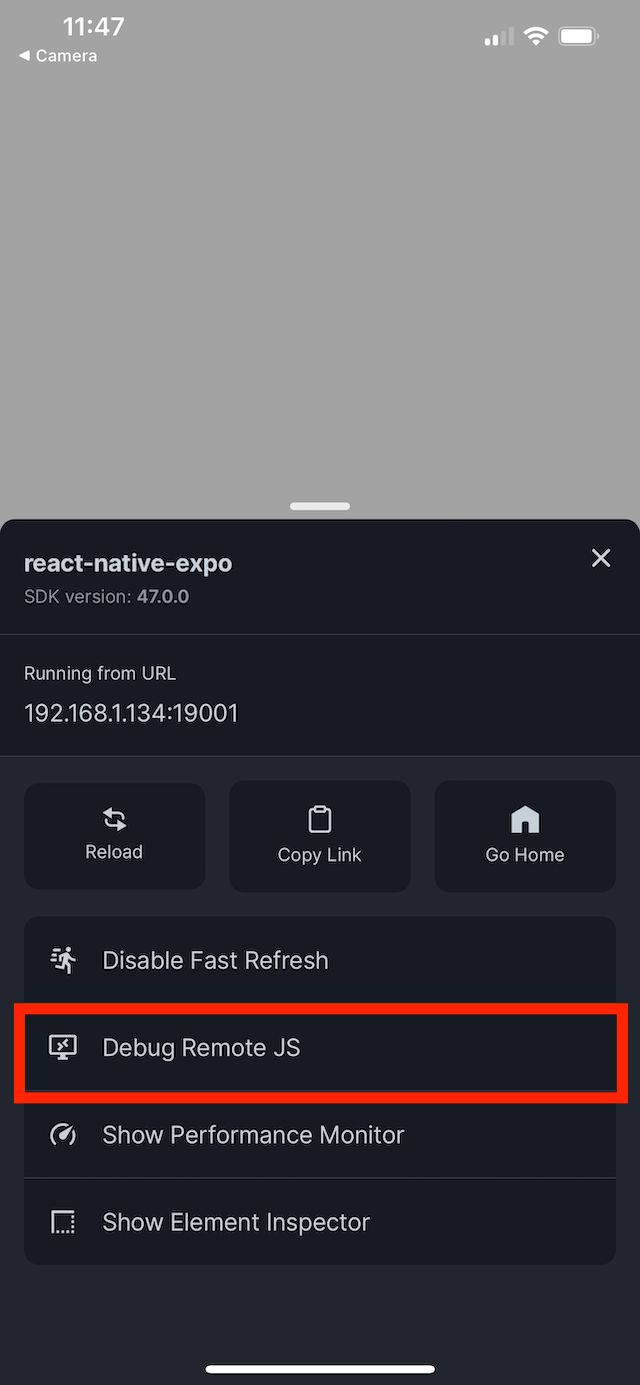
Once selected now the VSCode debugger can connect to the app running in Expo Go.
Step 8: Debugging the Button Press
Now we are all set to attach breakpoint to our buttonPressed() function.
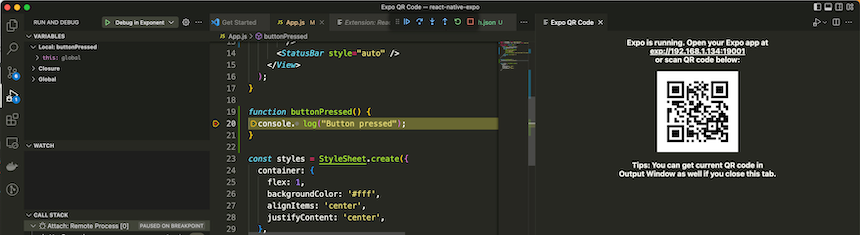
Open the App.js file and and scroll down to line 20, and attach the breakpoint to the first line of the buttonPressed() method.
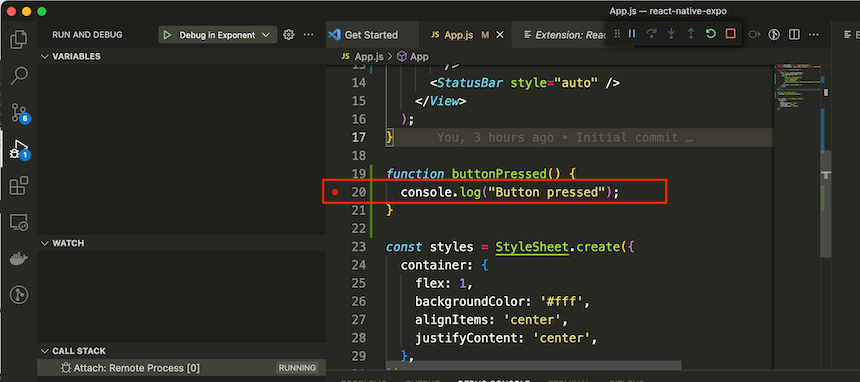
Now click on the button and you will see that the debugger has paused the execution of the code.
Step 9: That's it!
That's how easy it is to add the debugger in the React Native Application created with Expo. If you have created the React Native application using the React Native Cli then, read the instructions below.
Debugging React Native Cli Apps
Refer to this section if you have created your react native app using the react native cli.
Step 1: Setting up the React Native Cli App
For the debugging demo we will create a button in React Native Cli App, and when the button is pressed a breakpoint will trigger and debugger will pause the code execution.
After you have setup the environment we will create a sample app using the react native cli
npx react-native init AwesomeProjectIt will take some time to setup the application, once it is done we will cd into the project directory
cd AwesomeProjectWe will start the react native Metro Bundler using the command
npx react-native startNow we will open a new terminal window, and cd into our project directory and run the command
npx react-native run-iosOR
npx react-native run-androidTo launch the app is android or ios emulator respectively.
Step 2: Creating a Button
Now we will update the code of our React Native application add a button, and a create a function that will be called when the button is pressed.
Open the project in VSCode, by cd into the project directory and using the code command
code .Once the project is opened in VSCode, navigate to the App.js file create a button after the <View .. component
          <Button
              onPress={ButtonPressed}
              title="Learn More"
              color="#841584"
              accessibilityLabel="Learn more about this purple button"
                />
Then near the bottom of the page create the ButtonPressed function
function ButtonPressed() {
  console.log("Button Pressed");
}
Here is the complete App.js code:
/**
 * Sample React Native App
 * https://github.com/facebook/react-native
 *
 * @format
 * @flow strict-local
 */

import React from 'react';
import type {Node} from 'react';
import {
  SafeAreaView,
  ScrollView,
  StatusBar,
  StyleSheet,
  Text,
  useColorScheme,
  View,
  Button
} from 'react-native';

import {
  Colors,
  DebugInstructions,
  Header,
  LearnMoreLinks,
  ReloadInstructions,
} from 'react-native/Libraries/NewAppScreen';

/* $FlowFixMe[missing-local-annot] The type annotation(s) required by Flow's
 * LTI update could not be added via codemod */
const Section = ({children, title}): Node => {
  const isDarkMode = useColorScheme() === 'dark';
  return (
    <View style={styles.sectionContainer}>
      <Text
        style={[
          styles.sectionTitle,
          {
            color: isDarkMode ? Colors.white : Colors.black,
          },
        ]}>
        {title}
      </Text>
      <Text
        style={[
          styles.sectionDescription,
          {
            color: isDarkMode ? Colors.light : Colors.dark,
          },
        ]}>
        {children}
      </Text>
    </View>
  );
};

const App: () => Node = () => {
  const isDarkMode = useColorScheme() === 'dark';

  const backgroundStyle = {
    backgroundColor: isDarkMode ? Colors.darker : Colors.lighter,
  };

  return (
    <SafeAreaView style={backgroundStyle}>
      <StatusBar
        barStyle={isDarkMode ? 'light-content' : 'dark-content'}
        backgroundColor={backgroundStyle.backgroundColor}
      />
      <ScrollView
        contentInsetAdjustmentBehavior="automatic"
        style={backgroundStyle}>
        <Header />
        <View
          style={{
            backgroundColor: isDarkMode ? Colors.black : Colors.white,
          }}>

            <Button
                onPress={ButtonPressed}
                title="Learn More"
                color="#841584"
                accessibilityLabel="Learn more about this purple button"
                />

          <Section title="Step One ">
            Edit <Text style={styles.highlight}>App.js</Text> to change this
            screen and then come back to see your edits.
          </Section>
          <Section title="See Your Changes">
            <ReloadInstructions />
          </Section>
          <Section title="Debug">
            <DebugInstructions />
          </Section>
          <Section title="Learn More">
            Read the docs to discover what to do next:
          </Section>
          <LearnMoreLinks />
        </View>
      </ScrollView>
    </SafeAreaView>
  );
};

const styles = StyleSheet.create({
  sectionContainer: {
    marginTop: 32,
    paddingHorizontal: 24,
  },
  sectionTitle: {
    fontSize: 24,
    fontWeight: '600',
  },
  sectionDescription: {
    marginTop: 8,
    fontSize: 18,
    fontWeight: '400',
  },
  highlight: {
    fontWeight: '700',
  },
});

function ButtonPressed() {
  console.log("Button Pressed");
}

export default App;
After we have added the button the Metro bundler will recompile the application and it will automatically update in the simulator.
Step 3: Installing the React Native VSCode Extension
Open VSCode Extensions menu and search for "React Native Tools" and install the extension

Step 4a: Debug Android App
To setup the extension to debug Android app, click on the run and debug menu and select "create a launch.json" button

Then Select "React Native" from the dropdown menu
Then from the list make sure "Debug Android" is selected
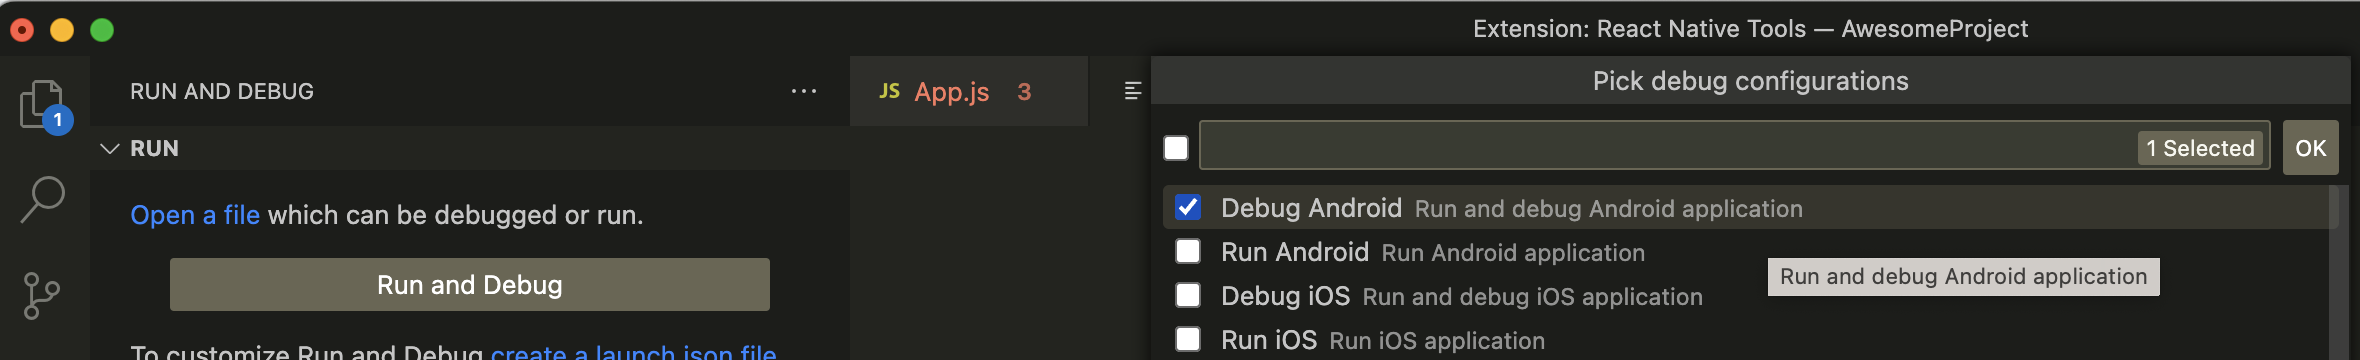
And Click "OK" button and Click "Debug Android" button to launch the Android Emulator and debugger.
Step 4b: Debug iOS App
The step for debugging iOS App is very similar to debugging Android App.
After installing the extension, create the "launch.json" file
Then Select React Native from the dropdown
Then from the Select box, select Debug iOS, it will Add the iOS Debug configuation is launch.json file.
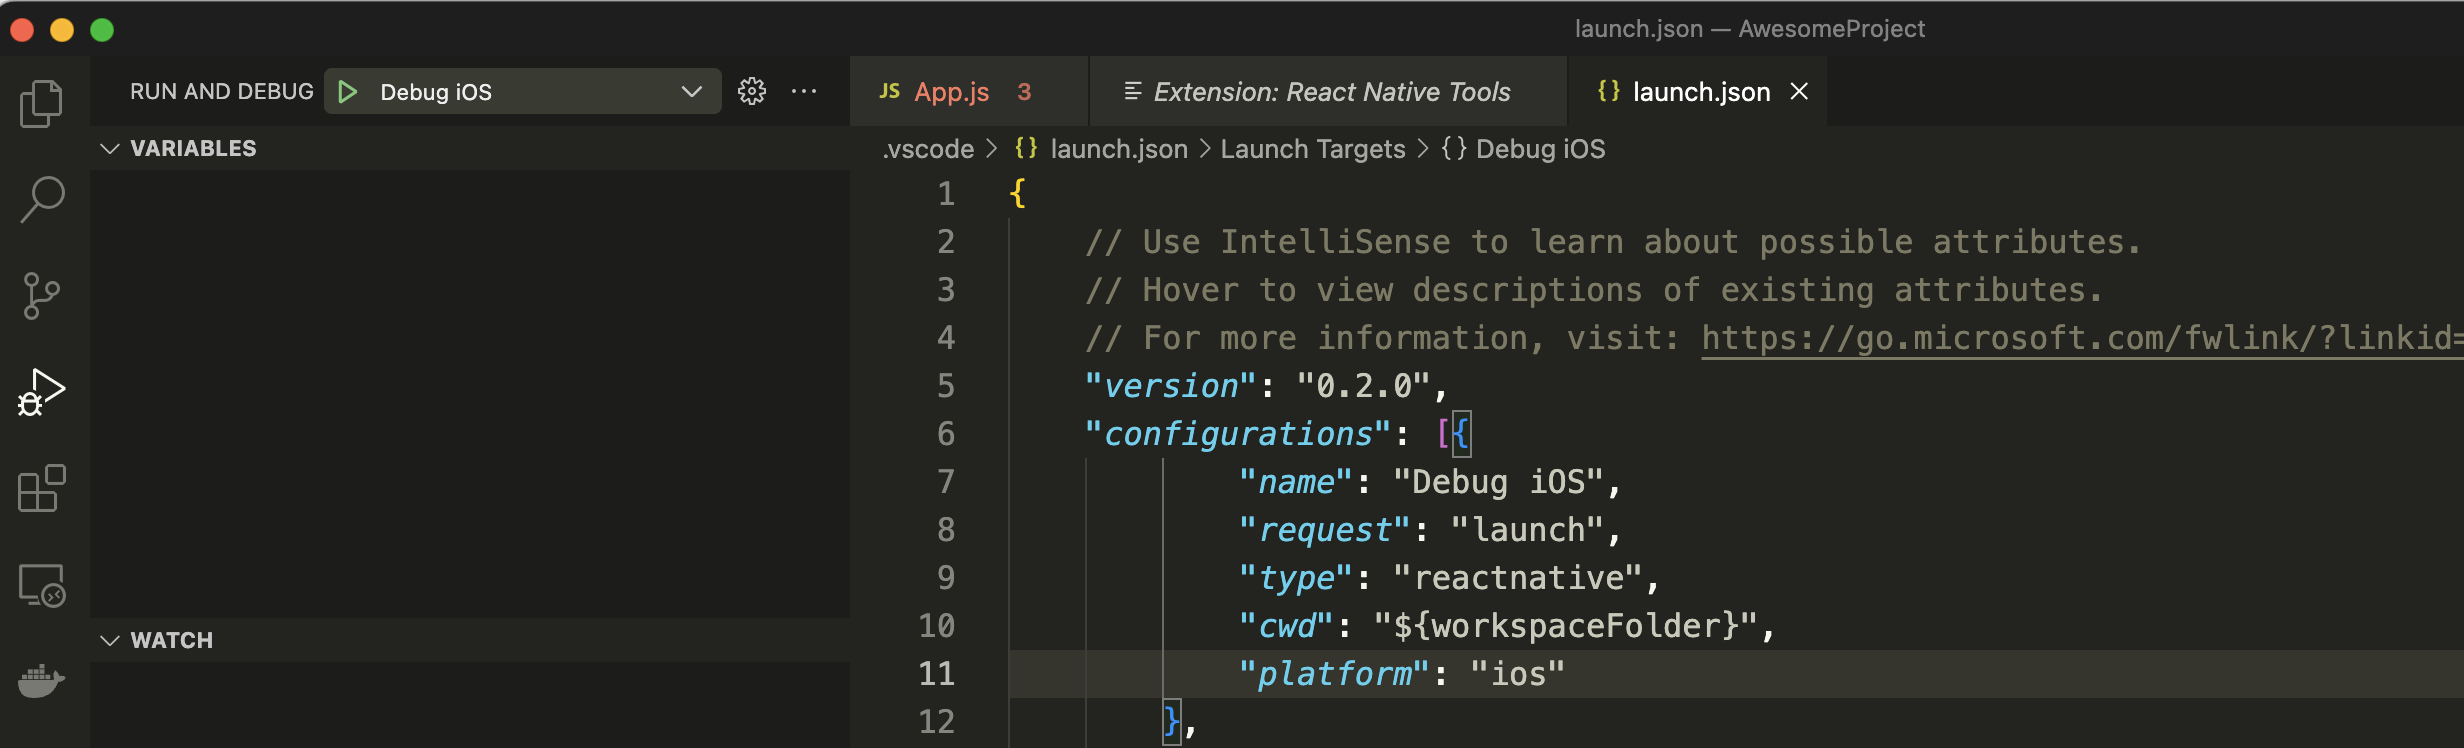
Click the "Debug iOS" button to launch the debugger, the debugger will launch the iOS emulator.
Step 5: (Important) Make sure remote debugging is enabled
In the Android emulator press CTRL+M or CMD+M and click the Debug button.
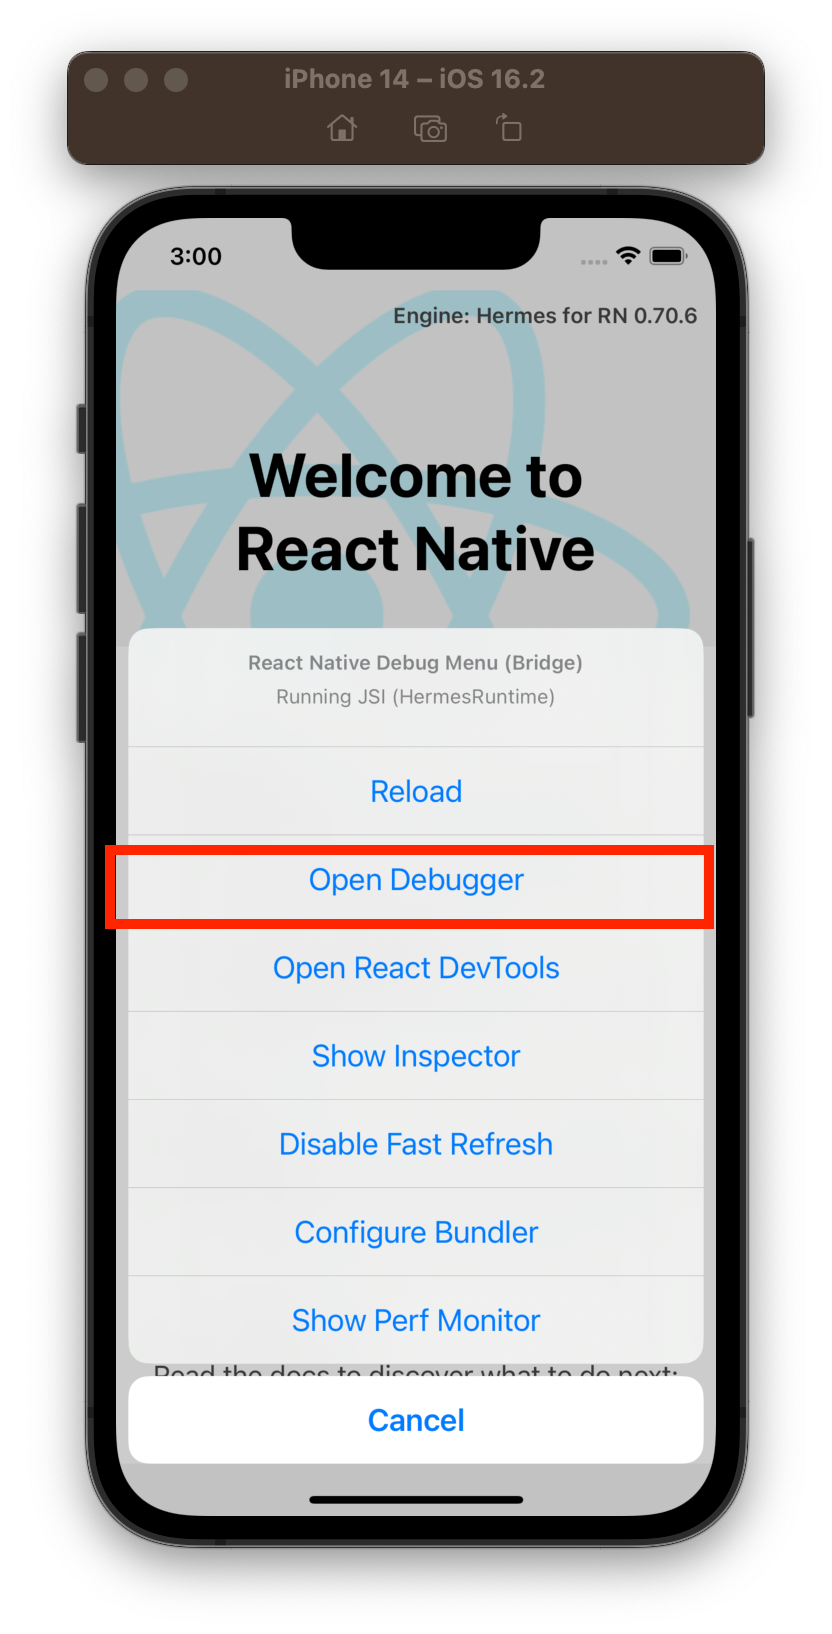
In case of iOS Emulor press CMD+D to open the Debug Menu and press "Open Debugger" button.
That's it! Now we are ready to debug our application.
Step 6: Debugging the Button Press
Now we are ready to start debugging our application, we will add a breakpoint to our "ButtonPressed" function, and launch the app in the emulator.
The we will press the button in the emulator, and the debugger should pause the execution of the code at the line where we have added the breakpoint.
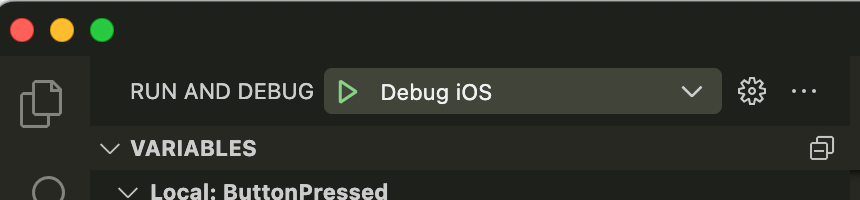
Press the "Debug iOS" button to lauch the App in the iOS emulator, if we want to debug the Anroid App we will select "Debug iOS" and it will launch the app in the Android Emulator.
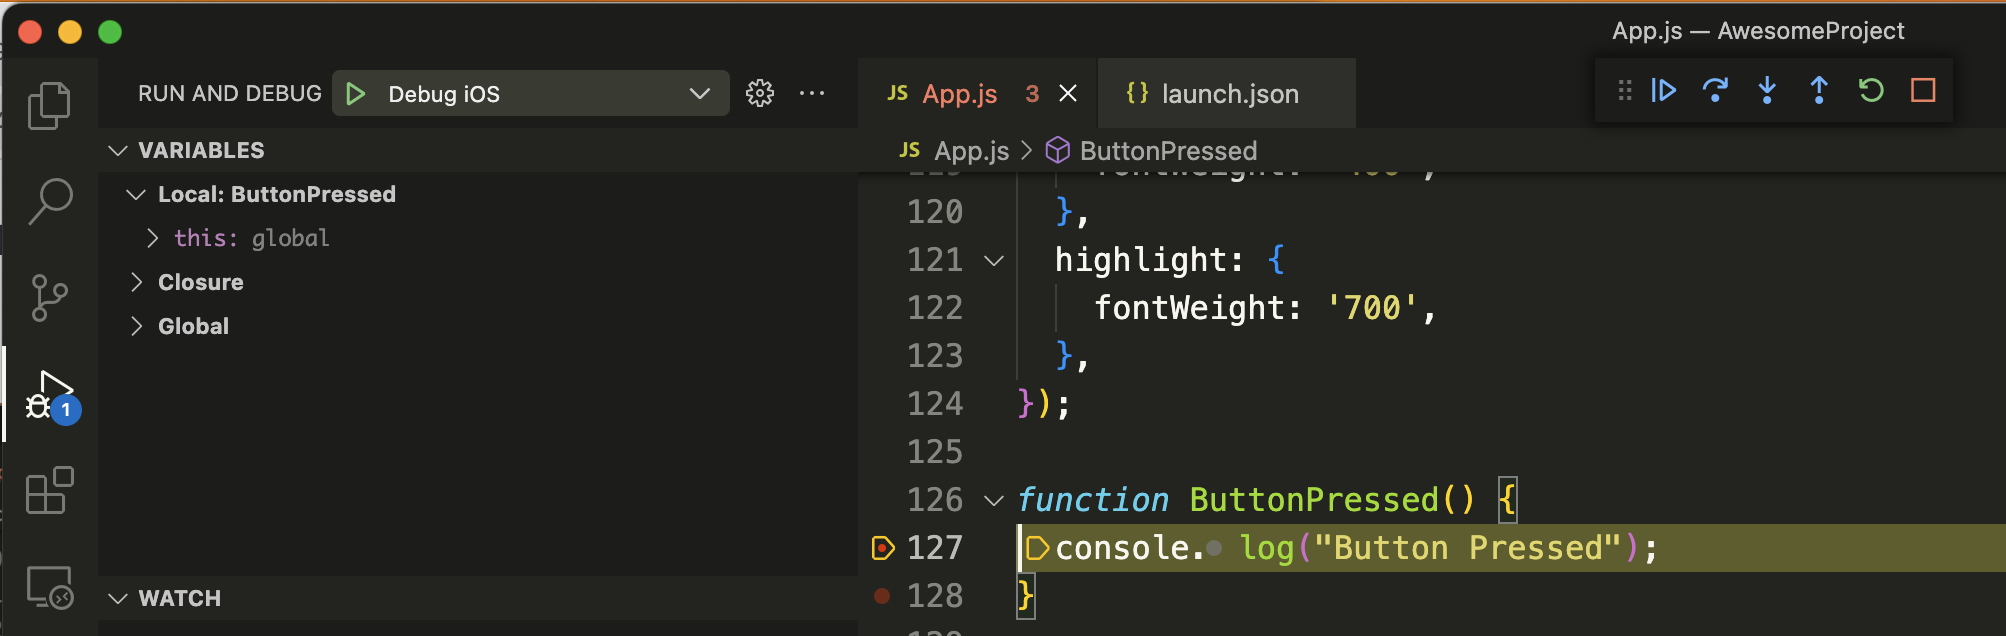
Now open App.js file and add the breakpoint on the first line of the "ButtonPressed" method.
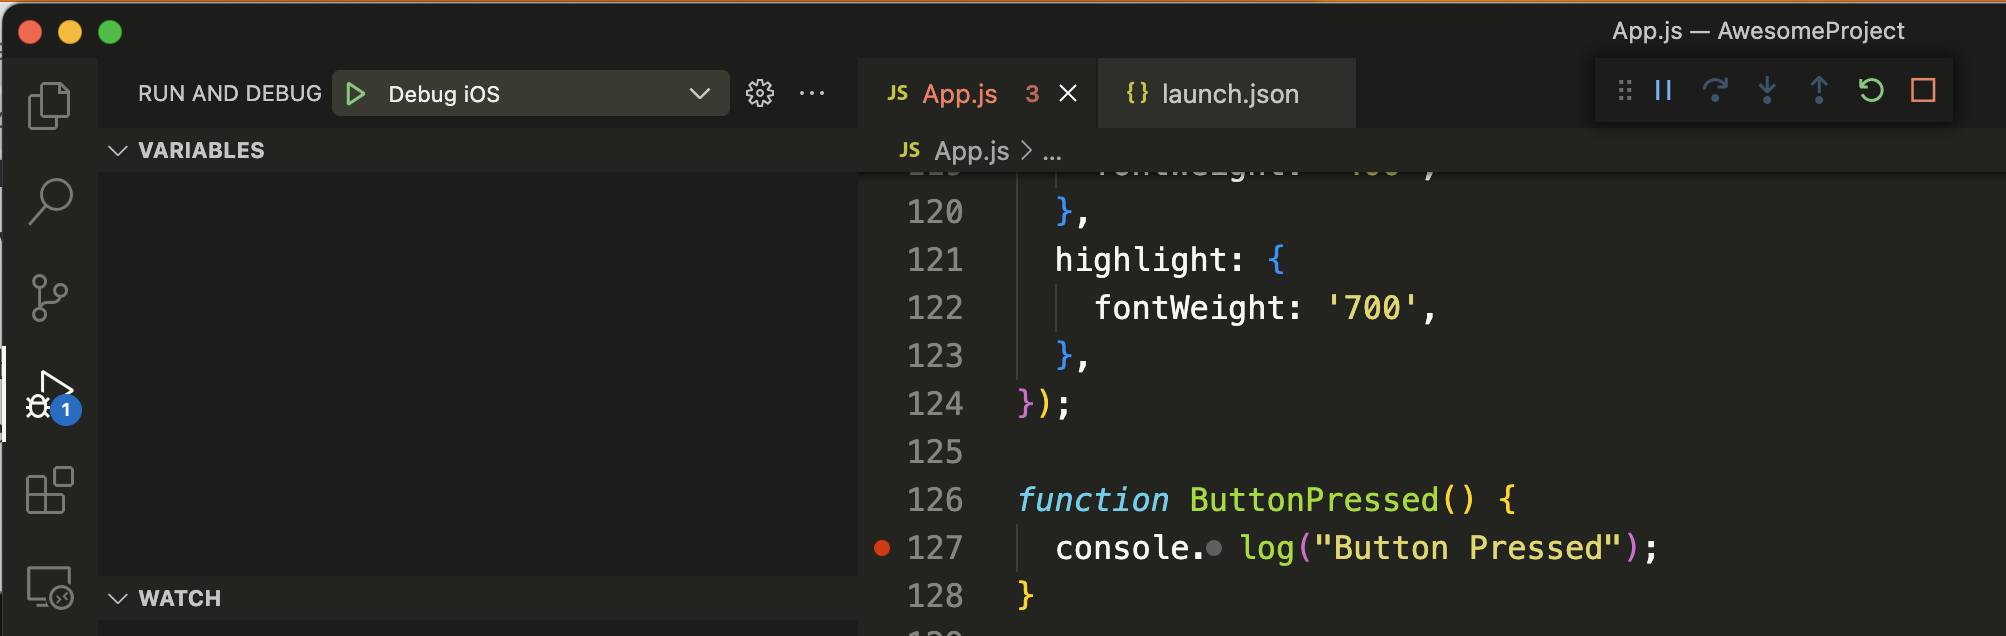
Now wait for the app to launch in the emulator, and once the app is live, press the "Learn more button" and you will see that the debugger has paused the code execution.
If the debugger didn't pause at the breakpoint make sure that you have enable remote debugging as shown in Step 5.
Common Problems
Here is the list of common problems that you might encounter when setting up the debugger and how to solve them:
error listen EADDRINUSE: address already in use :::8081
If you enouter this error then the npx react-native start program is already running in the terminal.
Terminate the program using Cltr+c to solve this error.
error occurred when launching application
An error occurred while launching the application. Failed to launch the specified activity.
Try running application manually and start debugging using
'Attach to packager' launch configuration. (error code 1205)
(error code 303)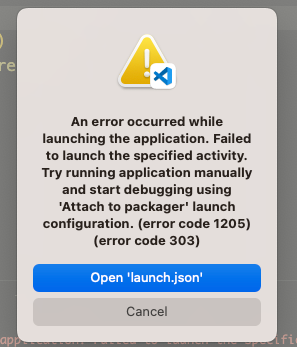
This error usually occurs when react native debugger when timeout occurs when connecting to the emulator.
It occurs when the debugger launches the emulator for the first time.
Wait for the emulator to completely start, and the re-run the debugger to solve this issue.
Debugger not stopping at breakpoint
Make sure that follow Step 5 in case of React Native Cli Apps or Step 7 in case of Expo apps.
The remote debug must be enable for the debugger to work.
Enable remote debug then stop and re-run the debugger to solve this issue.
An error occurred while attaching debugger to the application.
An error occurred while attaching debugger to the application.
Another debugger is already connected to packager. Please close it before trying to debug with VSCode. (error code 505) (error code 1410)
This error occurs when both iOS and Android emulator is open on the same machine.
Make sure only one emulator is running, and close other emulator windows and this error should go away.
If this error presist, uninstall the "React native tools" extension and re-install it. Then close VSCode completely and restart VSCode to solve this error.
Here are some relevant articles that are a good read
- React Profiler: A Step by step guide to measuring app performance
- React Native Chat App Tutorial in 3 steps.
- React useState: The Complete guide
- React useDeferredValue
Conclusion
In this tutorial we have gone through the steps on how to setup a debugger for React Native application created using React Native Cli and also gone through the steps of debugging application created using Expo.
Add In-App Chat with one-line of code to your React Native application with Dead Simple Chat Chat APIs.
DeadSimpleChat is a powerful in-app chat solution for React Native Applications, with DeadSimpleChat SDK easily add in-app chat to your React Native Application in minutes.
Ready to Add Chat to Your Website?
Get started for free. No credit card required.
Start a Free Trial
![Webinar Chat: The Complete Guide to Engaging Your Audience [2026]](/blog/content/images/size/w600/2026/02/article-hero-webinar-chat.svg)